Analysis of Function App logs
Following are the approaches for collecting the logs of function apps and sending them to log analytics workspace: -
-
Diagnostic Logs
-
Initial background: -
-
The diagnostic settings have not been enabled for the function apps. In the diagnostic policy for app service, the function apps have been excluded from the resource type since the log categories are different for app services and function apps.
-
Thus, policy should be there in place to enable the diagnostic settings of function apps.
-
Log category to be enabled: FunctionAppLogs
-
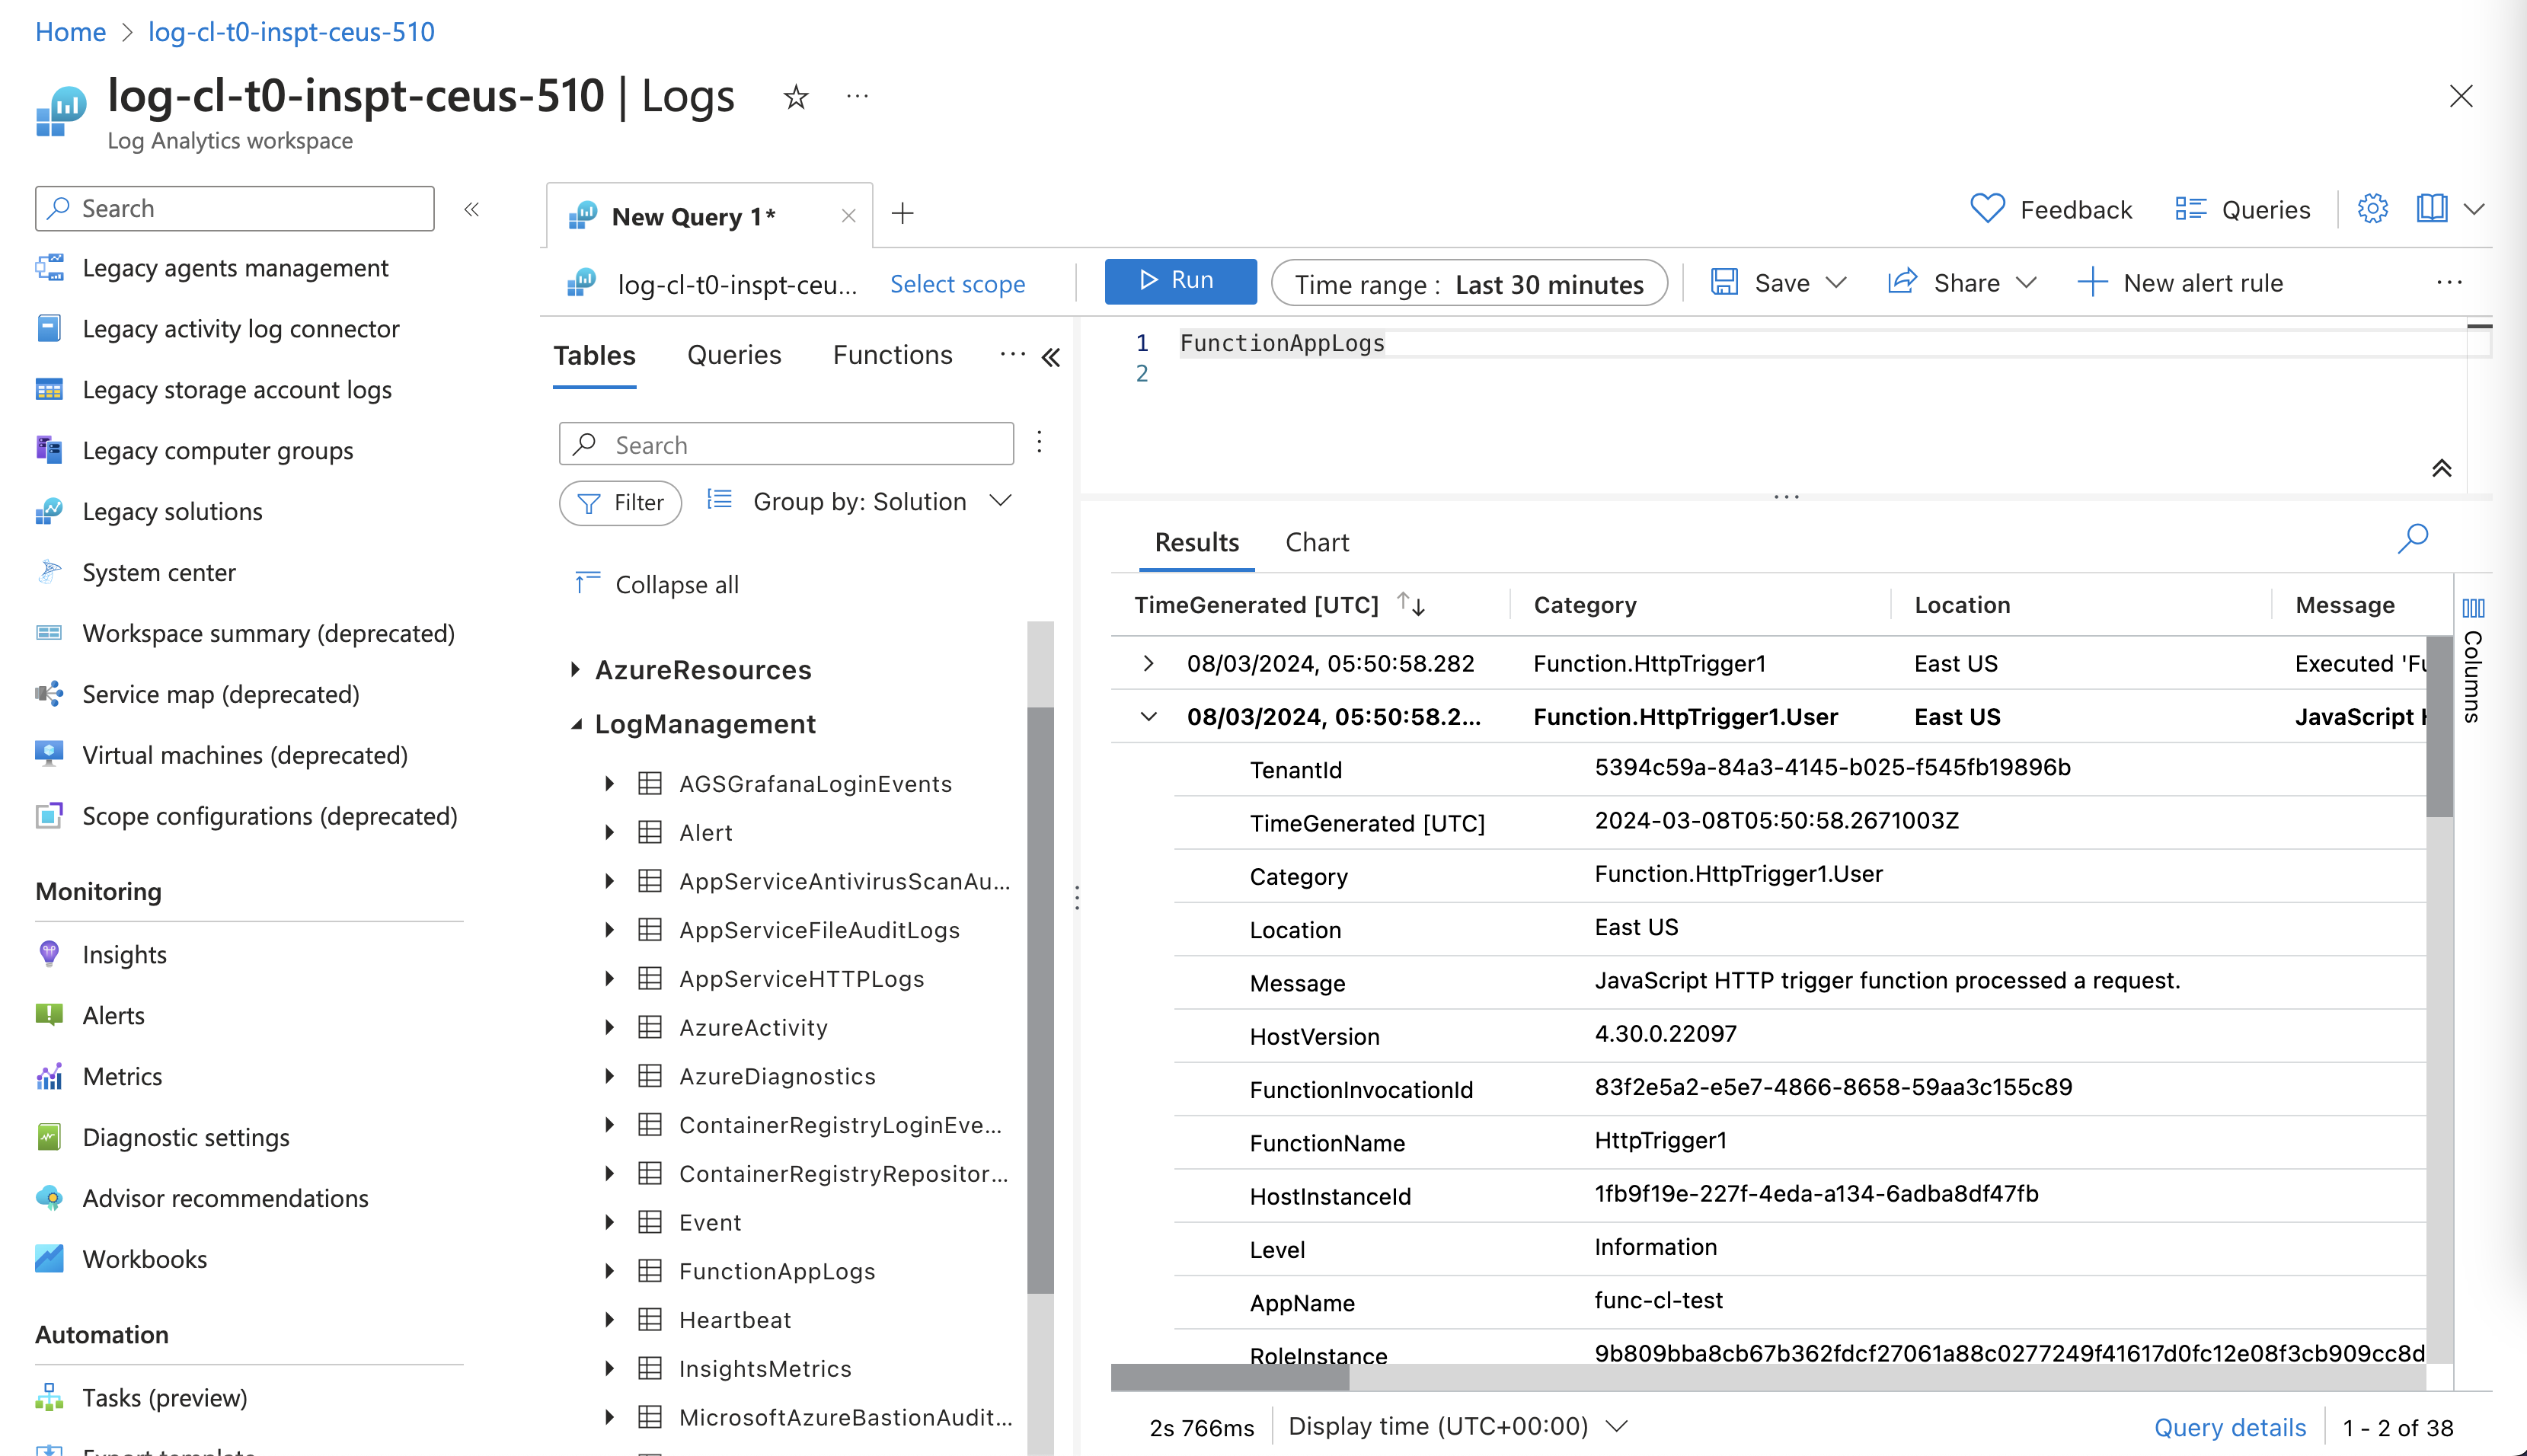
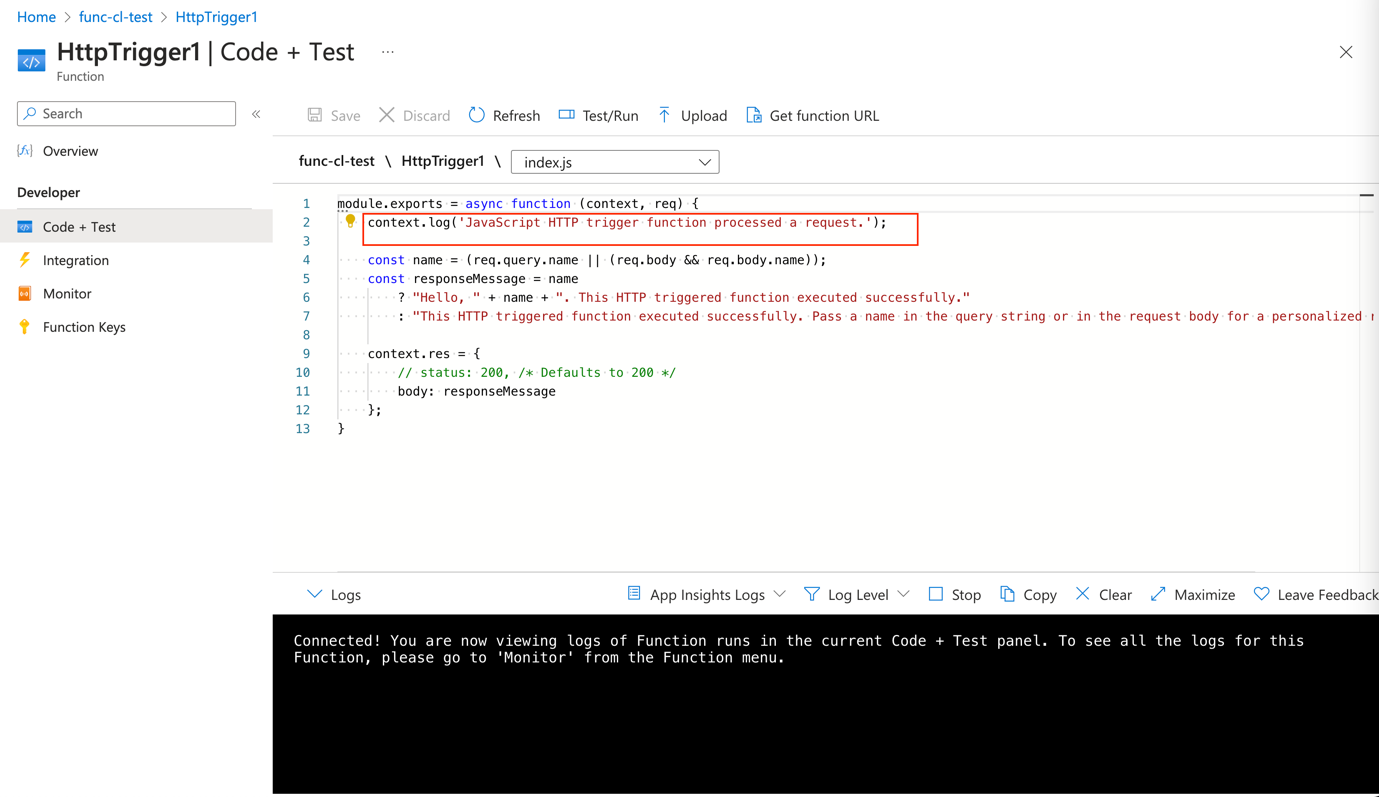
It includes logs emitted by the Functions host and logs emitted by customer code.
-
https://learn.microsoft.com/en-us/azure/azure-functions/functions-monitor-log-analytics?tabs=javascript
-
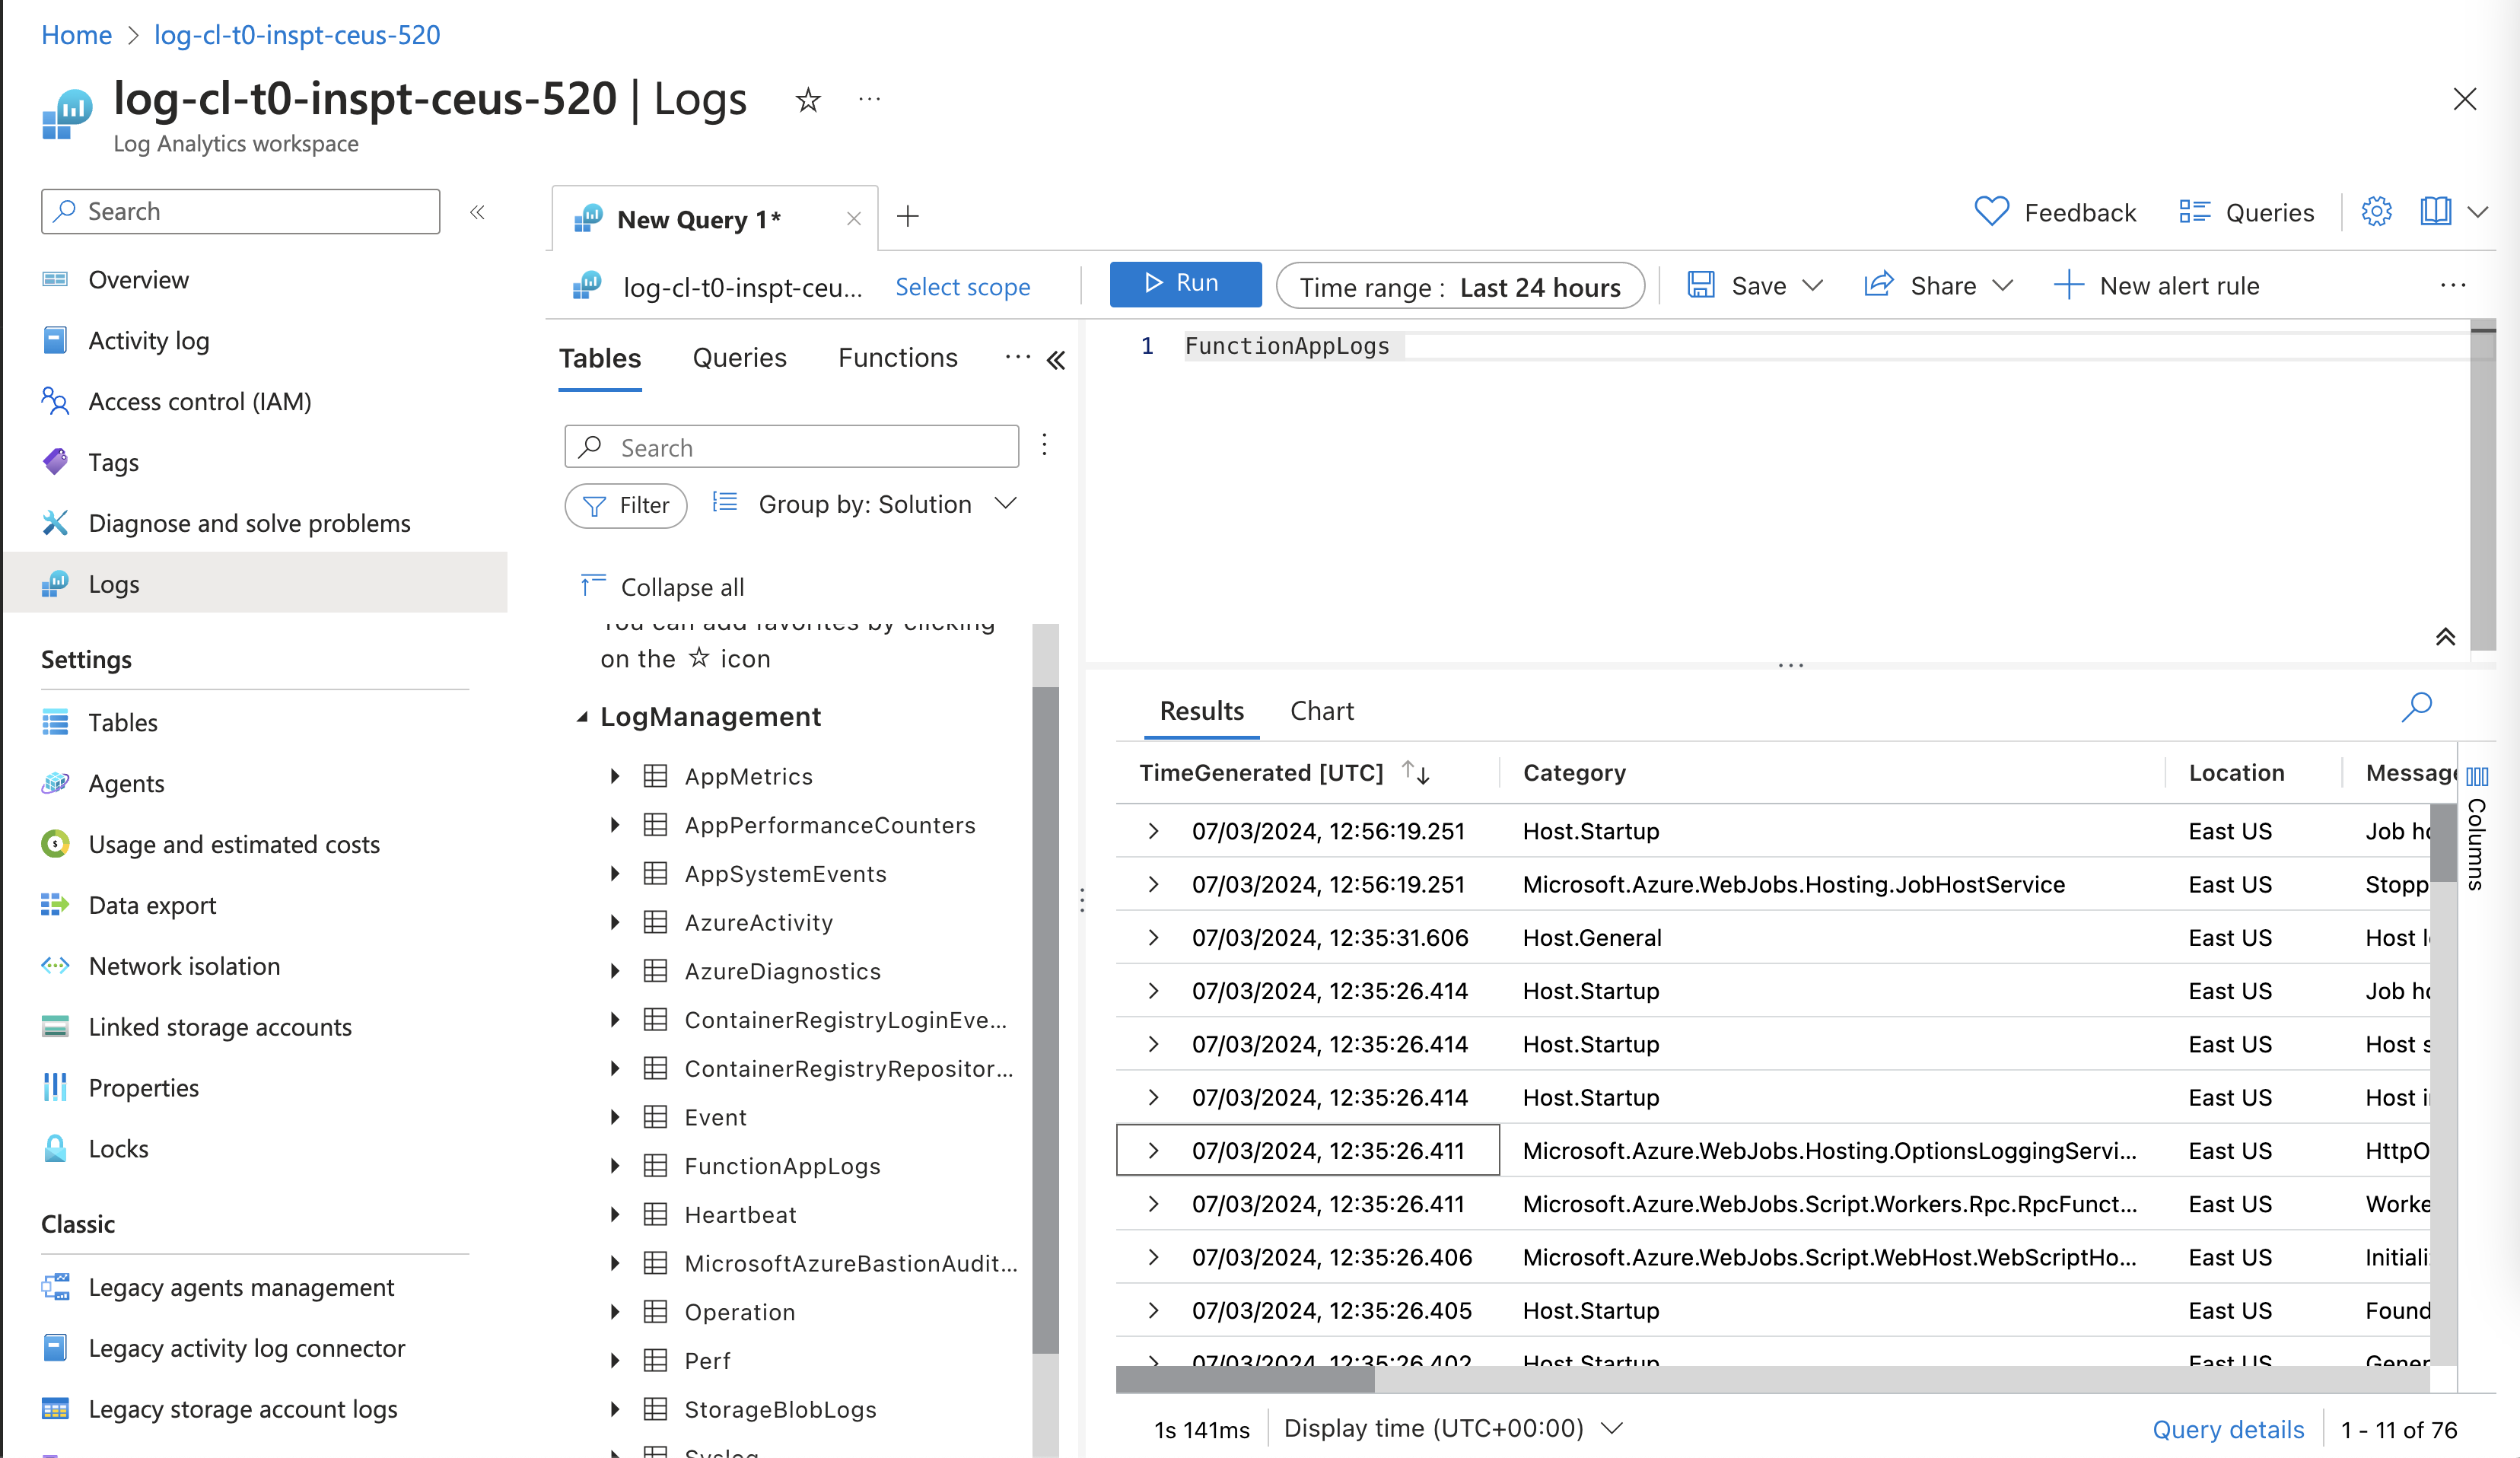
Table in LAW: FunctionAppLogs
-
Pros:
-
Built-in integration within Azure.
-
Can specify which logs categories to enable inside the setting.
-
Centralised management of the logs inside the LAW.
Cons:
-
Limited log categories (currently only one i.e. Function Application Logs)
-
Application Insights
-
By integrating the application insights with the Azure function apps, we can capture various types of logs and telemetry data in order to monitor and diagnose the performance and behaviour of the function apps.
-
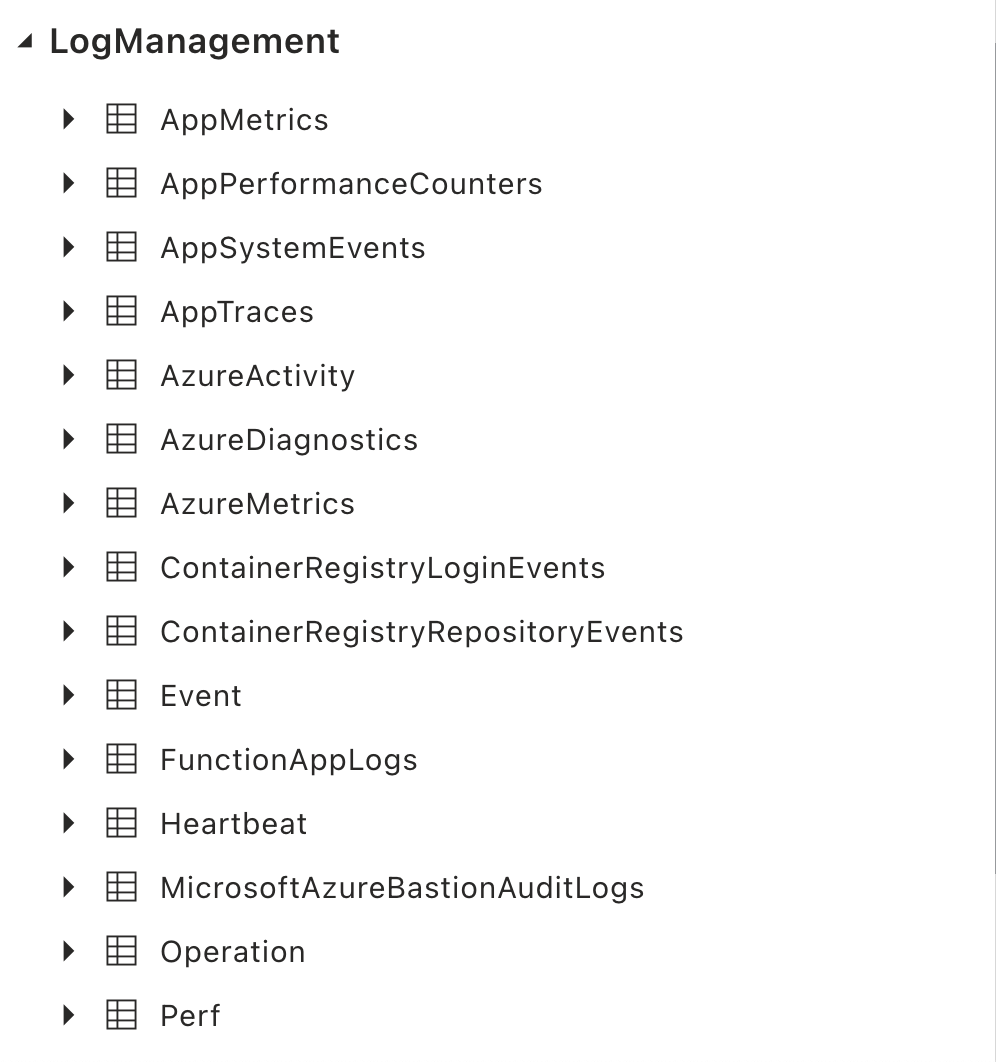
Various logs that get captured are:
-
Trace Logs: These are custom log messages that you can instrument within your function code using the Application Insights SDK. Trace logs can include informational messages, warnings, errors, and any other custom logging you define in your code.
-
Request Logs: Application Insights automatically captures telemetry data for each incoming HTTP request to your function applications. This includes details such as request duration, response status code, request URL, and any custom properties or metrics you instrument.
-
Exception Logs: Application Insights captures exceptions and errors thrown by your function code, including stack traces, exception types, and any custom properties associated with the exception. This helps you identify and diagnose errors in your application.
-
Dependency Logs: If your function applications make outbound HTTP requests or interact with other Azure services, Application Insights can capture telemetry data for these dependencies. This includes details such as dependency duration, success or failure status, and any custom properties or metrics associated with the dependency.
-
Performance Counters: Application Insights can capture performance counters from your function applications, including CPU usage, memory usage, and other system-level metrics. This helps you monitor the performance and resource utilization of your function applications.
-
Custom Metrics: In addition to built-in telemetry types, you can also define custom metrics to track specific performance indicators or business metrics within your function applications. These custom metrics can be visualized and analysed alongside other telemetry data in Application Insights.
Pros:-
- Advanced Monitoring features
Cons:-
-
Additional cost because it is a separate resource.
-
Additional setup is also required which can include modification to the function app also.
Conclusion:
In order to keep the uniformity among all the other existing policies and to incur less cost, enabling the diagnostic settings should be enough to gather the logs of the function apps. Here, only one table i.e. FunctionAppLogs will get populated.