Vm Logs Centralized Logging
Executive Summary
Purpose of the Document
This document describes the centralized logging solution for collecting application and operating-system logs from Windows and Linux virtual machines into Azure Log Analytics Workspace. The document presents two log-ingestion approaches and the disaster-recovery design for the workspace.
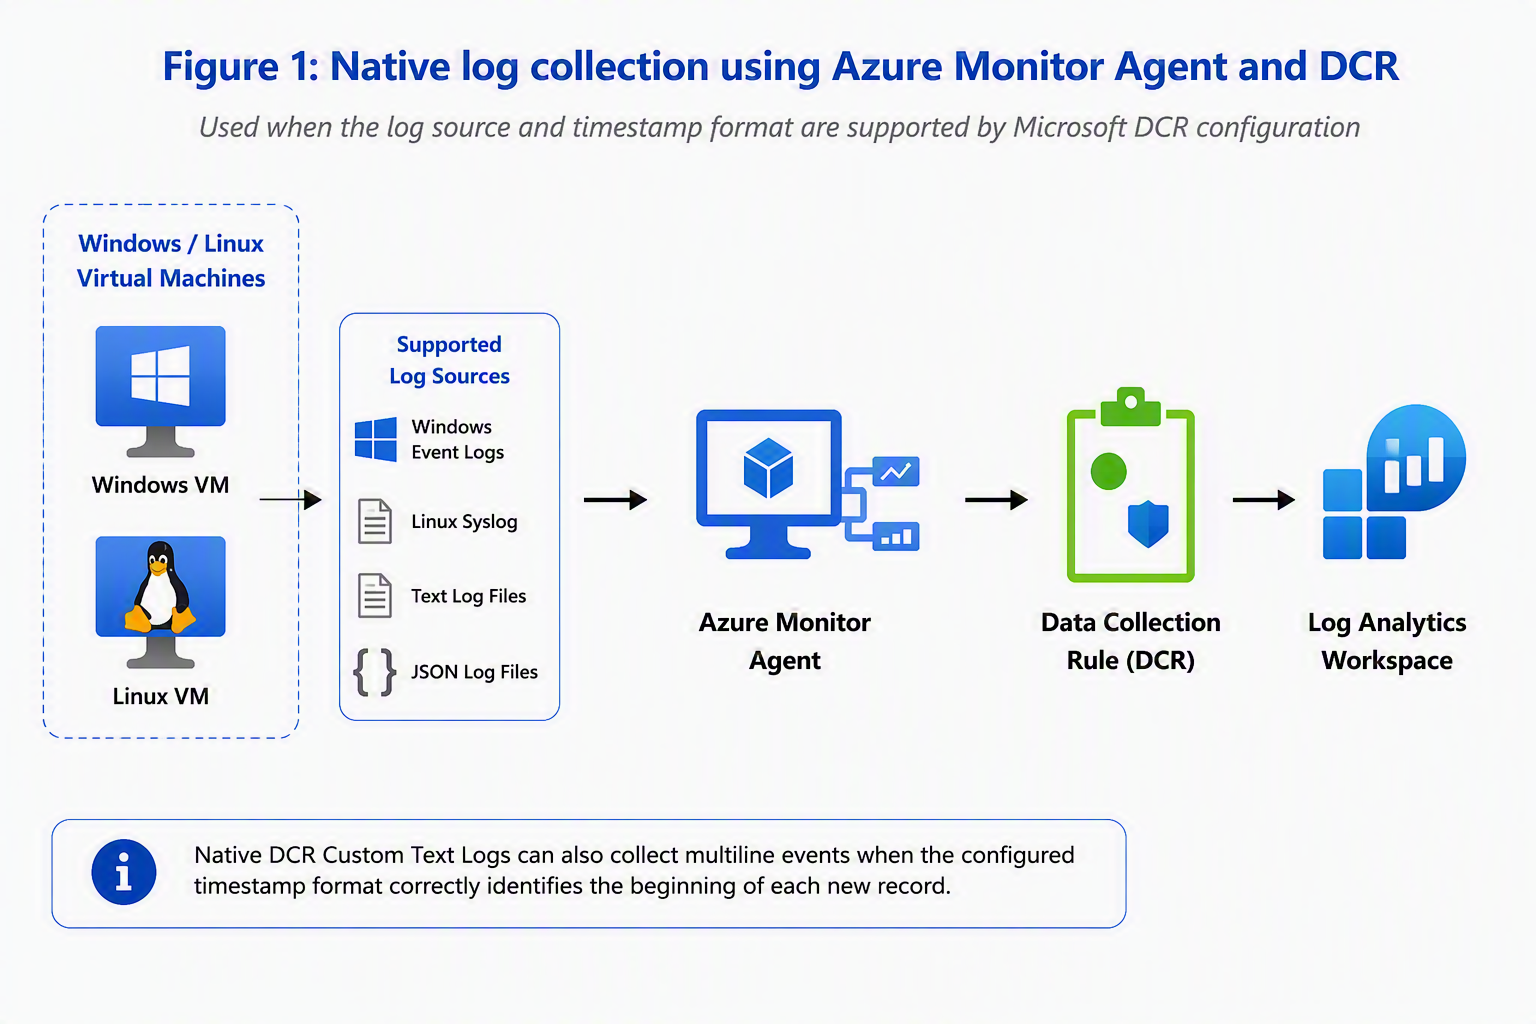
The first approach uses Azure Monitor Agent, Data Collection Rules, and Data Collection Endpoints where required. This approach is recommended when the log source and timestamp format are supported by the Microsoft DCR configuration. Native DCR Custom Text Logs can also collect multiline log events when the configured timestamp format correctly identifies the beginning of each new record. The subsequent lines are treated as part of the same event until the next supported timestamp is detected.
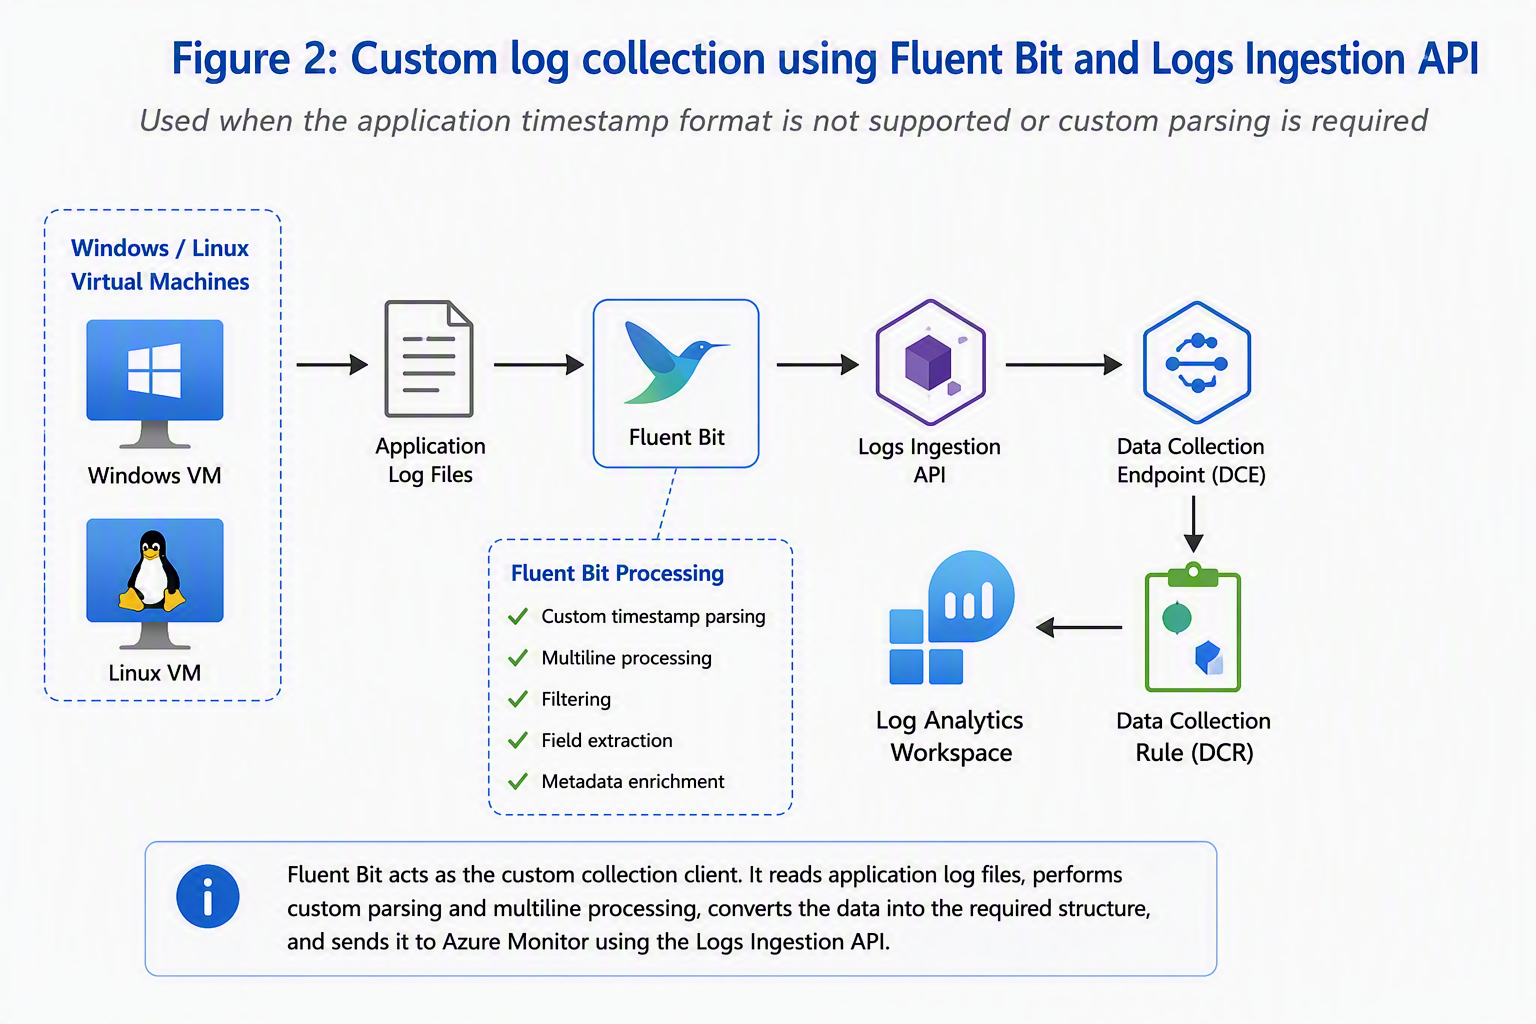
The second approach uses Fluent Bit with the Azure Monitor Logs Ingestion API, Data Collection Endpoint, and Data Collection Rule. This approach is recommended when the application uses a date or timestamp format that is not available in the native Microsoft DCR configuration, or when the logs require custom multiline parsing, filtering, field extraction, or metadata enrichment before ingestion.
The document also describes Log Analytics Workspace cross-region replication between Central US and East US 2, including the workspace-generated DCE, replication enablement, switchover, failback, Recovery Time Objective, Recovery Point Objective, and data-protection behaviour
Business Requirement
-
Collect application and operating-system logs from Windows and Linux VMs.
-
Store logs centrally in Log Analytics Workspace for troubleshooting, monitoring, reporting, audit, and security analysis.
-
Support applications that use different timestamp and multiline formats.
-
Provide regional disaster recovery for centralized log storage and query access.
Solution Overview
Native Architecture:
Second Approach:
Final Design Decision
Use AMA and native DCR when the application log uses a Microsoft-supported timestamp format. Use Fluent Bit with the Logs Ingestion API(DCE) when the required date or timestamp format is not available in the native DCR configuration.
| Log requirement | Recommended approach |
|---|---|
| Windows Event Logs | Azure Monitor Agent with native DCR |
| Linux Syslog | Azure Monitor Agent with native DCR |
| Text logs with Microsoft-supported timestamp formats | Azure Monitor Agent with native DCR Custom Text Logs |
| JSON logs with a defined schema | Azure Monitor Agent with native DCR Custom JSON Logs |
| Text logs with unsupported timestamp formats | Fluent Bit with Logs Ingestion API |
| Different applications using different timestamp formats | Fluent Bit with Logs Ingestion API |
| Custom filtering or field extraction required | Fluent Bit with Logs Ingestion API |
Approach 1: Native AMA and DCR Collection
When to use this Approach
-
The log source is Windows Event Log or Linux Syslog.
-
The application writes to a supported text or JSON file.
-
The timestamp format is available in the Microsoft DCR configuration.
-
Record boundaries can be identified using the configured timestamp.
-
Custom preprocessing is not required. Supported Log Sources
When to use this Approach
| Operating system | Supported source | Typical LAW destination |
|---|---|---|
| Windows | Windows Event Logs | Event |
| Windows | Custom text logs | Custom _CL table |
| Windows | Custom JSON logs | Schema-mapped custom table |
| Linux | Syslog | Syslog |
| Linux | Custom text logs | Custom _CL table |
| Linux | Custom JSON logs | Schema-mapped custom table |
Native Architecture
Steps to configure
The following steps describe how to configure Azure Monitor Agent and a Data Collection Rule to collect supported logs from Windows and Linux virtual machines.
- Verify the Prerequisites
Before creating the Data Collection Rule, confirm the following:
• The Windows or Linux virtual machine is running and accessible.
• The destination Log Analytics Workspace exists.
• The required custom table exists for Custom Text Logs or Custom JSON Logs.
• The user has permission to create and manage Data Collection Rules.
• The user has permission to associate the DCR with the virtual machines.
• The source log file exists on the virtual machine.
• The application timestamp format is supported by the Microsoft DCR configuration.
• The custom table schema matches the expected incoming data.
The DCR should be created in the same region as the destination Log Analytics Workspace.
- Create the Custom Table
This step is required for Custom Text Logs and Custom JSON Logs.
-
Open the Azure portal.
-
Navigate to the destination Log Analytics Workspace.
-
Select Tables.
-
Select Create.
-
Select New custom log (DCR-based).
-
Provide sample log data.
-
Define and verify the table schema.
-
Provide a custom table name.
Example:
ApplicationLogs_CL
The custom table name must end with the _CL suffix.
For Custom Text Logs, the destination table should include the required TimeGenerated column and a column for the collected record, such as RawData.
Example:
TimeGenerated datetime
RawData string
-
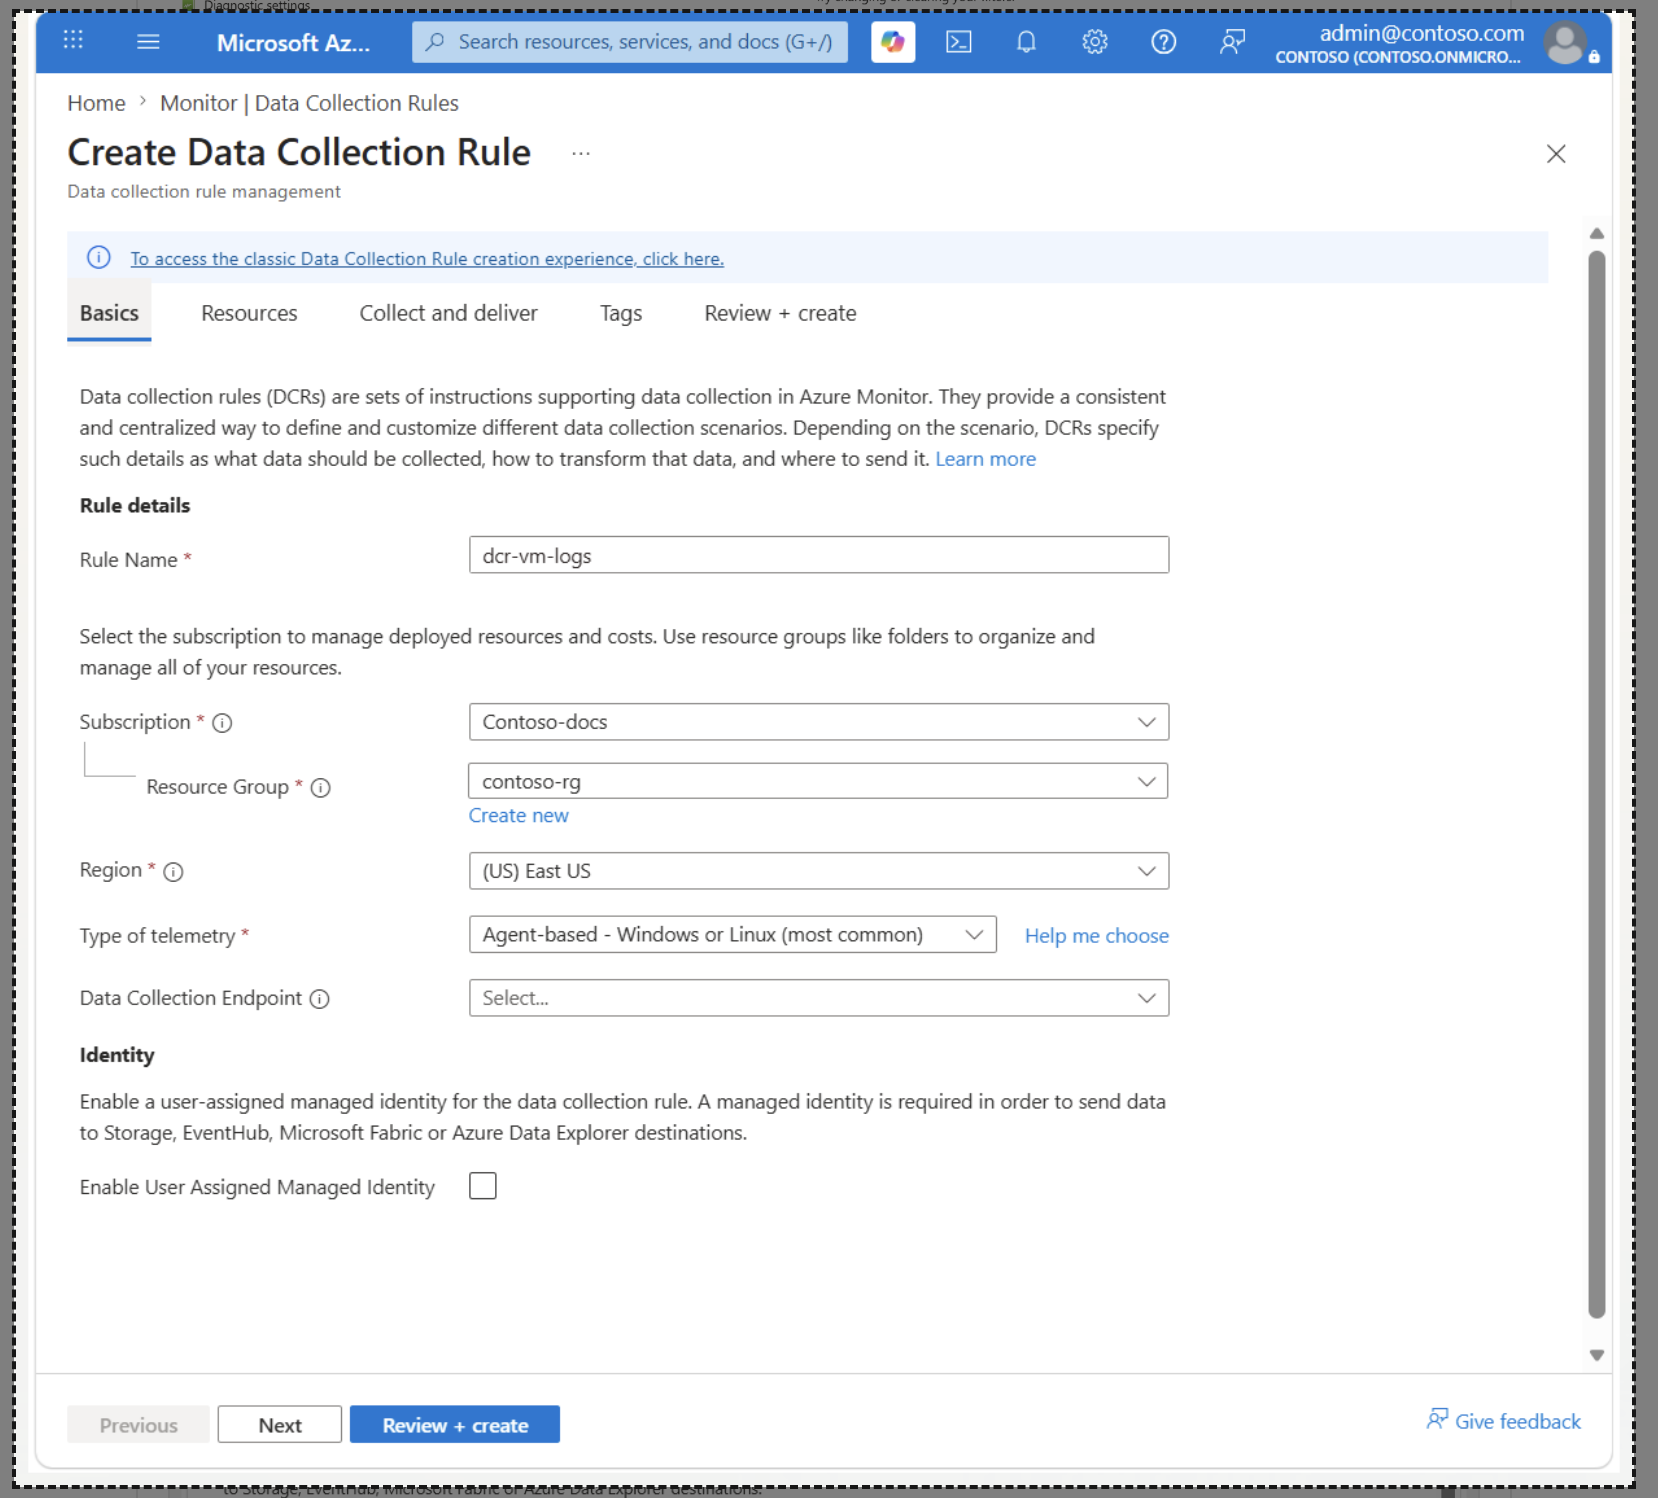
Create the Data Collection Rule
-
In the Azure portal, navigate to Azure Monitor.
-
Select Data Collection Rules.
-
Select Create.
-
Enter the required DCR details.
-
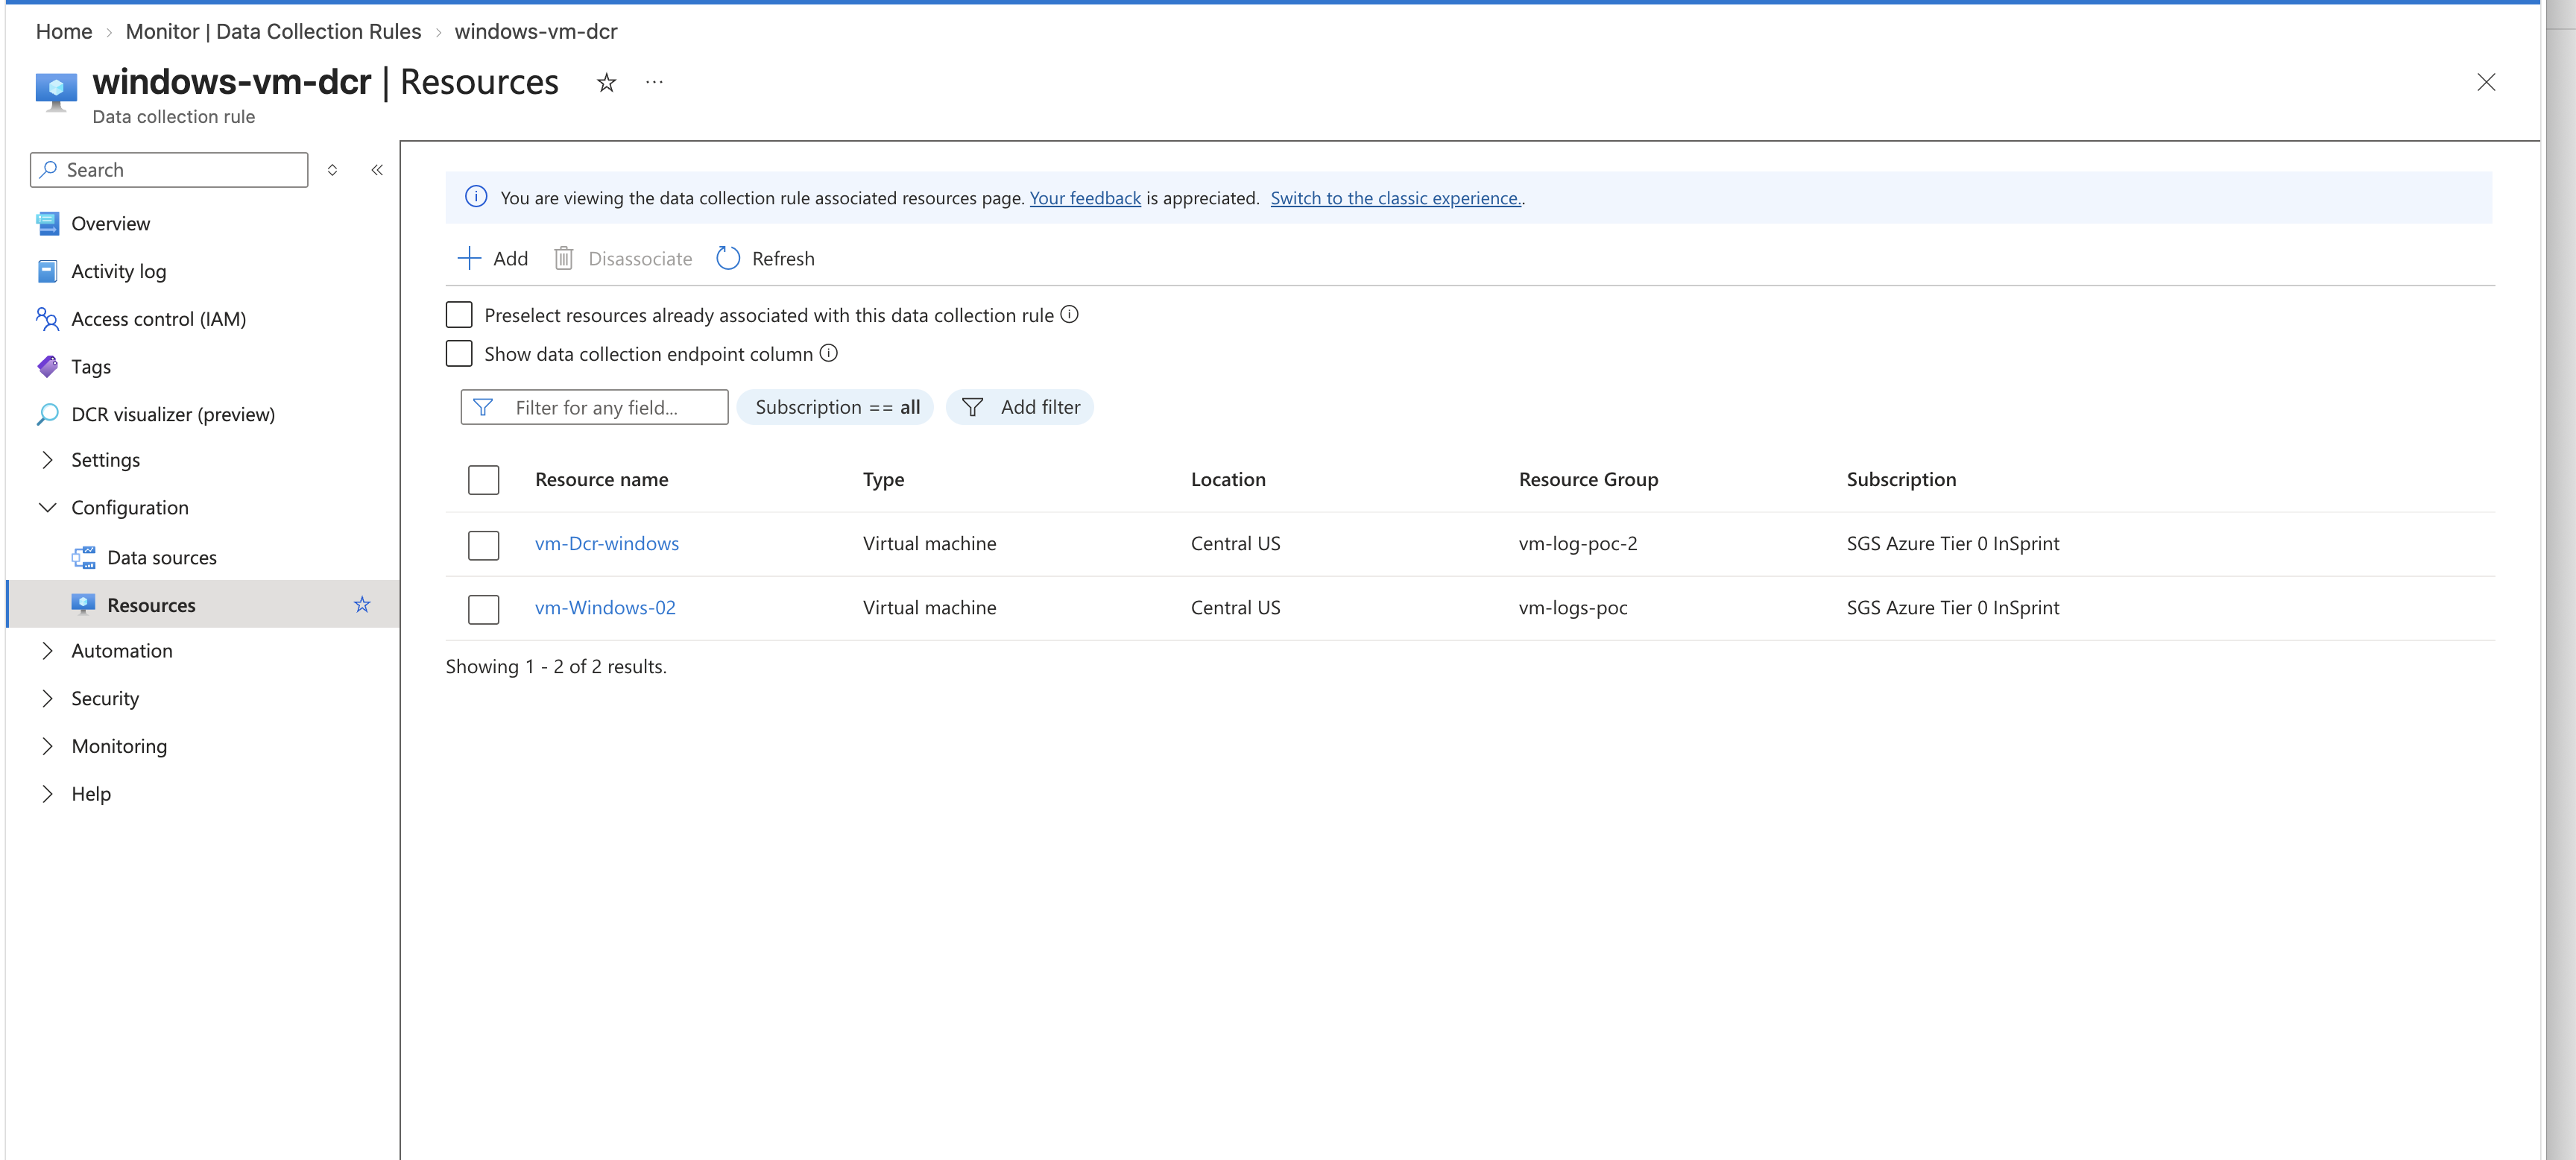
Add the Virtual Machines
-
On the Resources tab, select Add resources.
-
Select the required Windows or Linux virtual machines.
-
Confirm the resource selection.
-
Select Apply.
Azure creates a Data Collection Rule Association between the DCR and each selected virtual machine.
Azure Monitor Agent retrieves the associated DCR configuration and uses it to determine which logs must be collected.
A single DCR can be associated with multiple virtual machines. A virtual machine can also be associated with multiple DCRs.
- Add the Data Source
Select Add data source and configure the required source type.
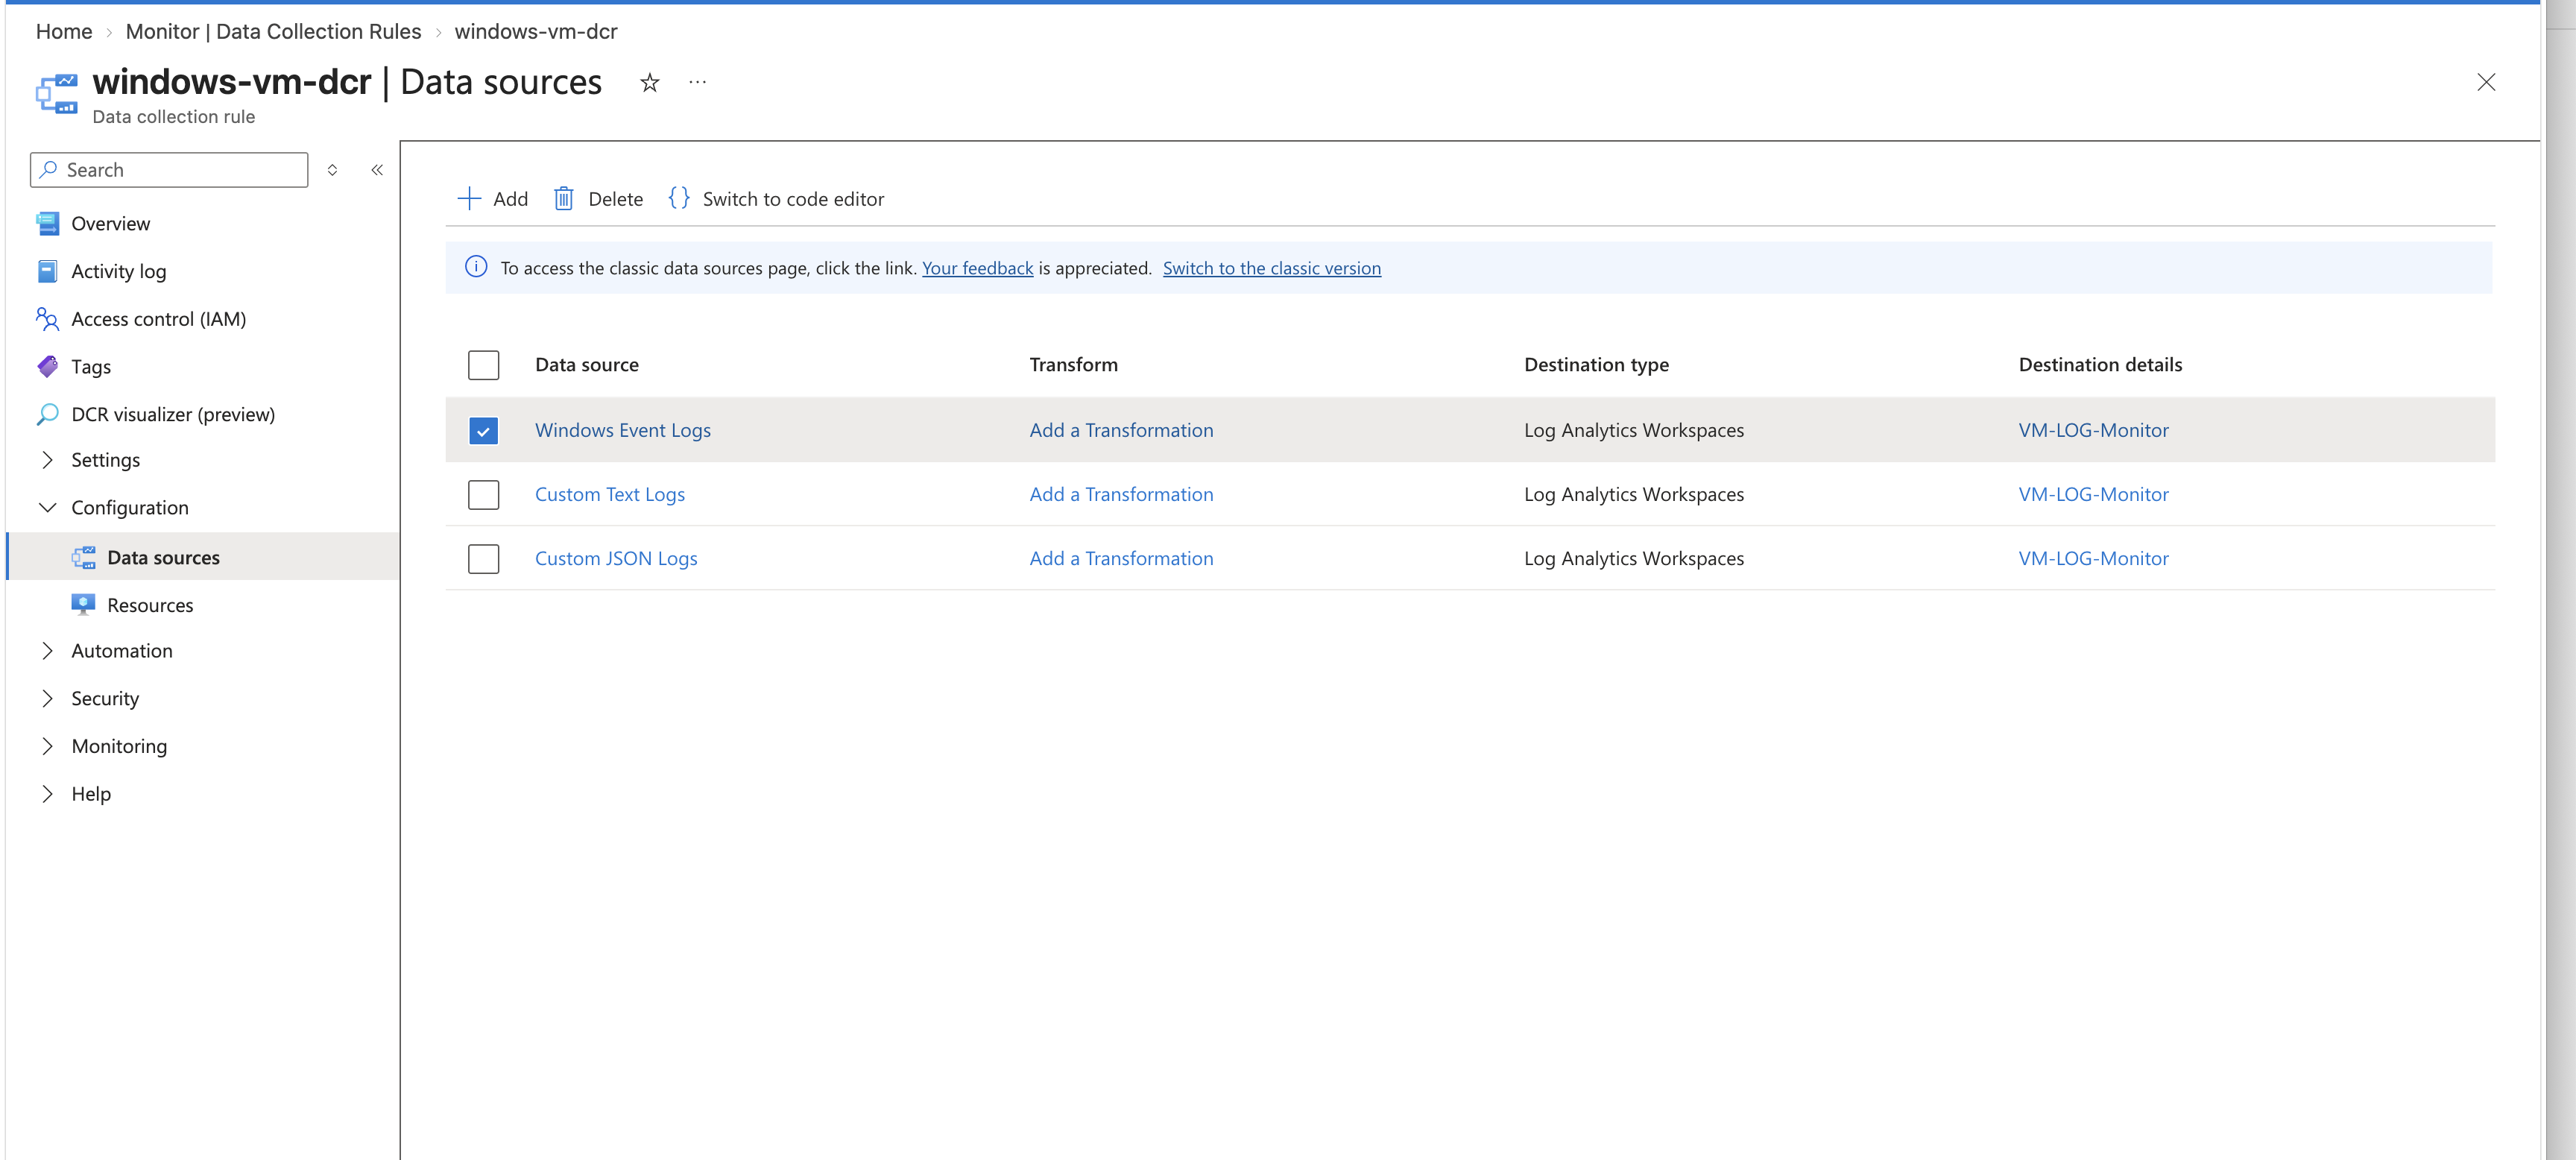
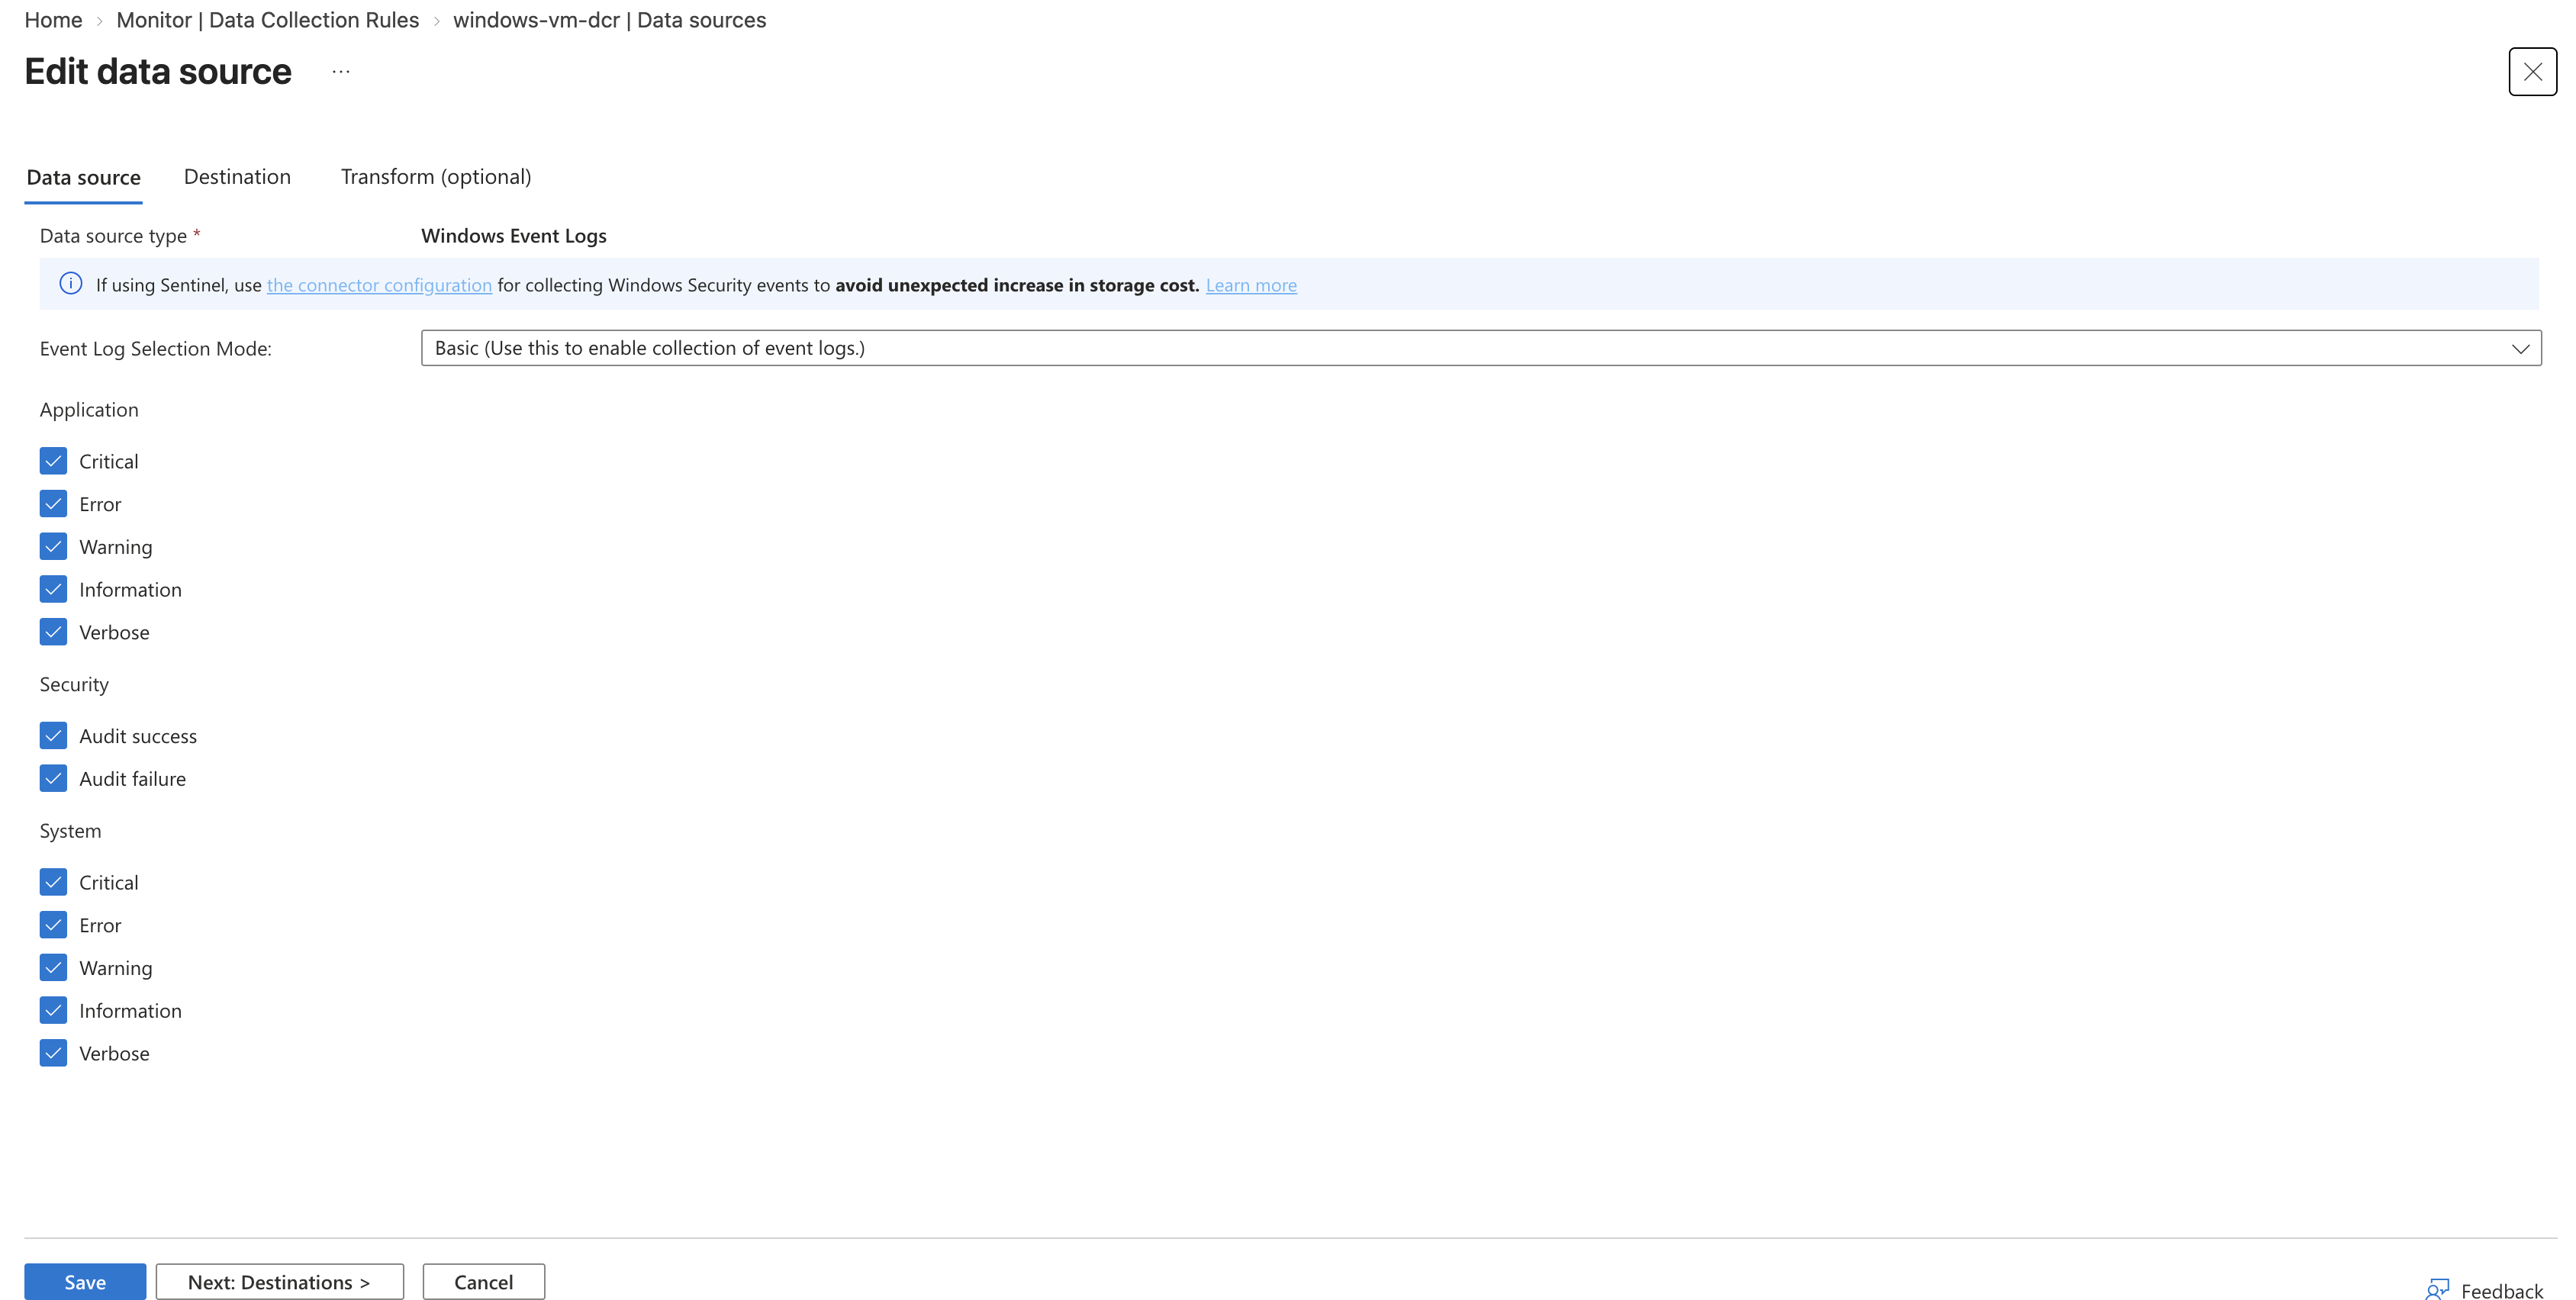
5.1 Windows Event Logs
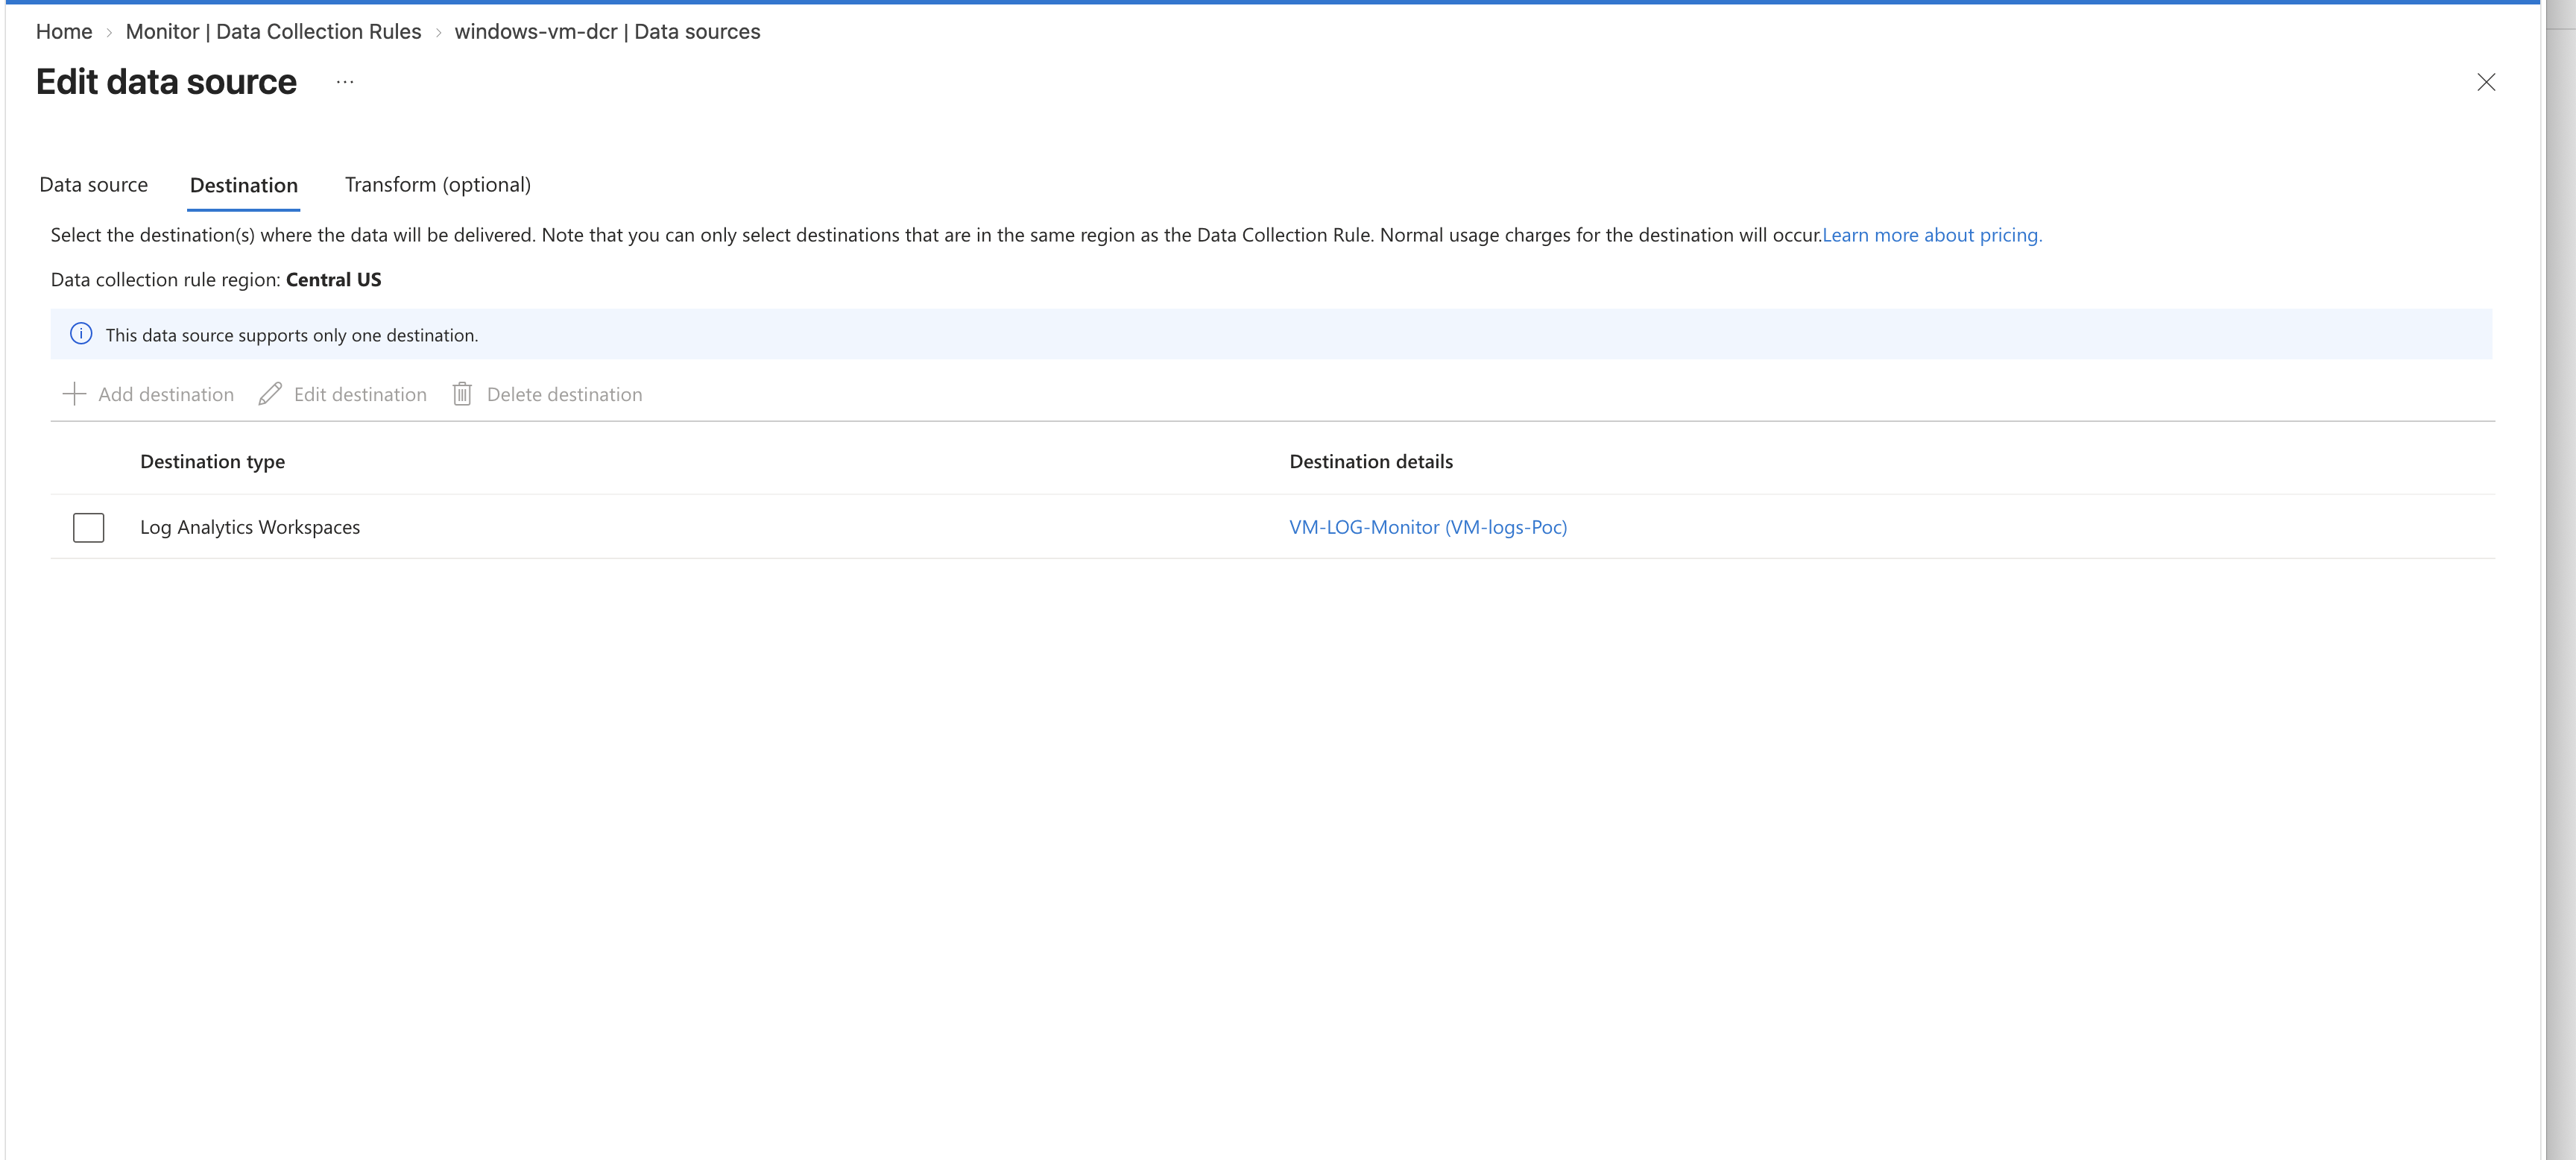
For Windows Event Logs:
-
Select Windows Event Logs as the data source type.
-
Select the required event-log channels and severity levels.
-
Configure the required XPath query if advanced filtering is needed.
Example channels:
• Application
• System
• Security
-
Select the destination Log Analytics Workspace.
-
Save the data source configuration.
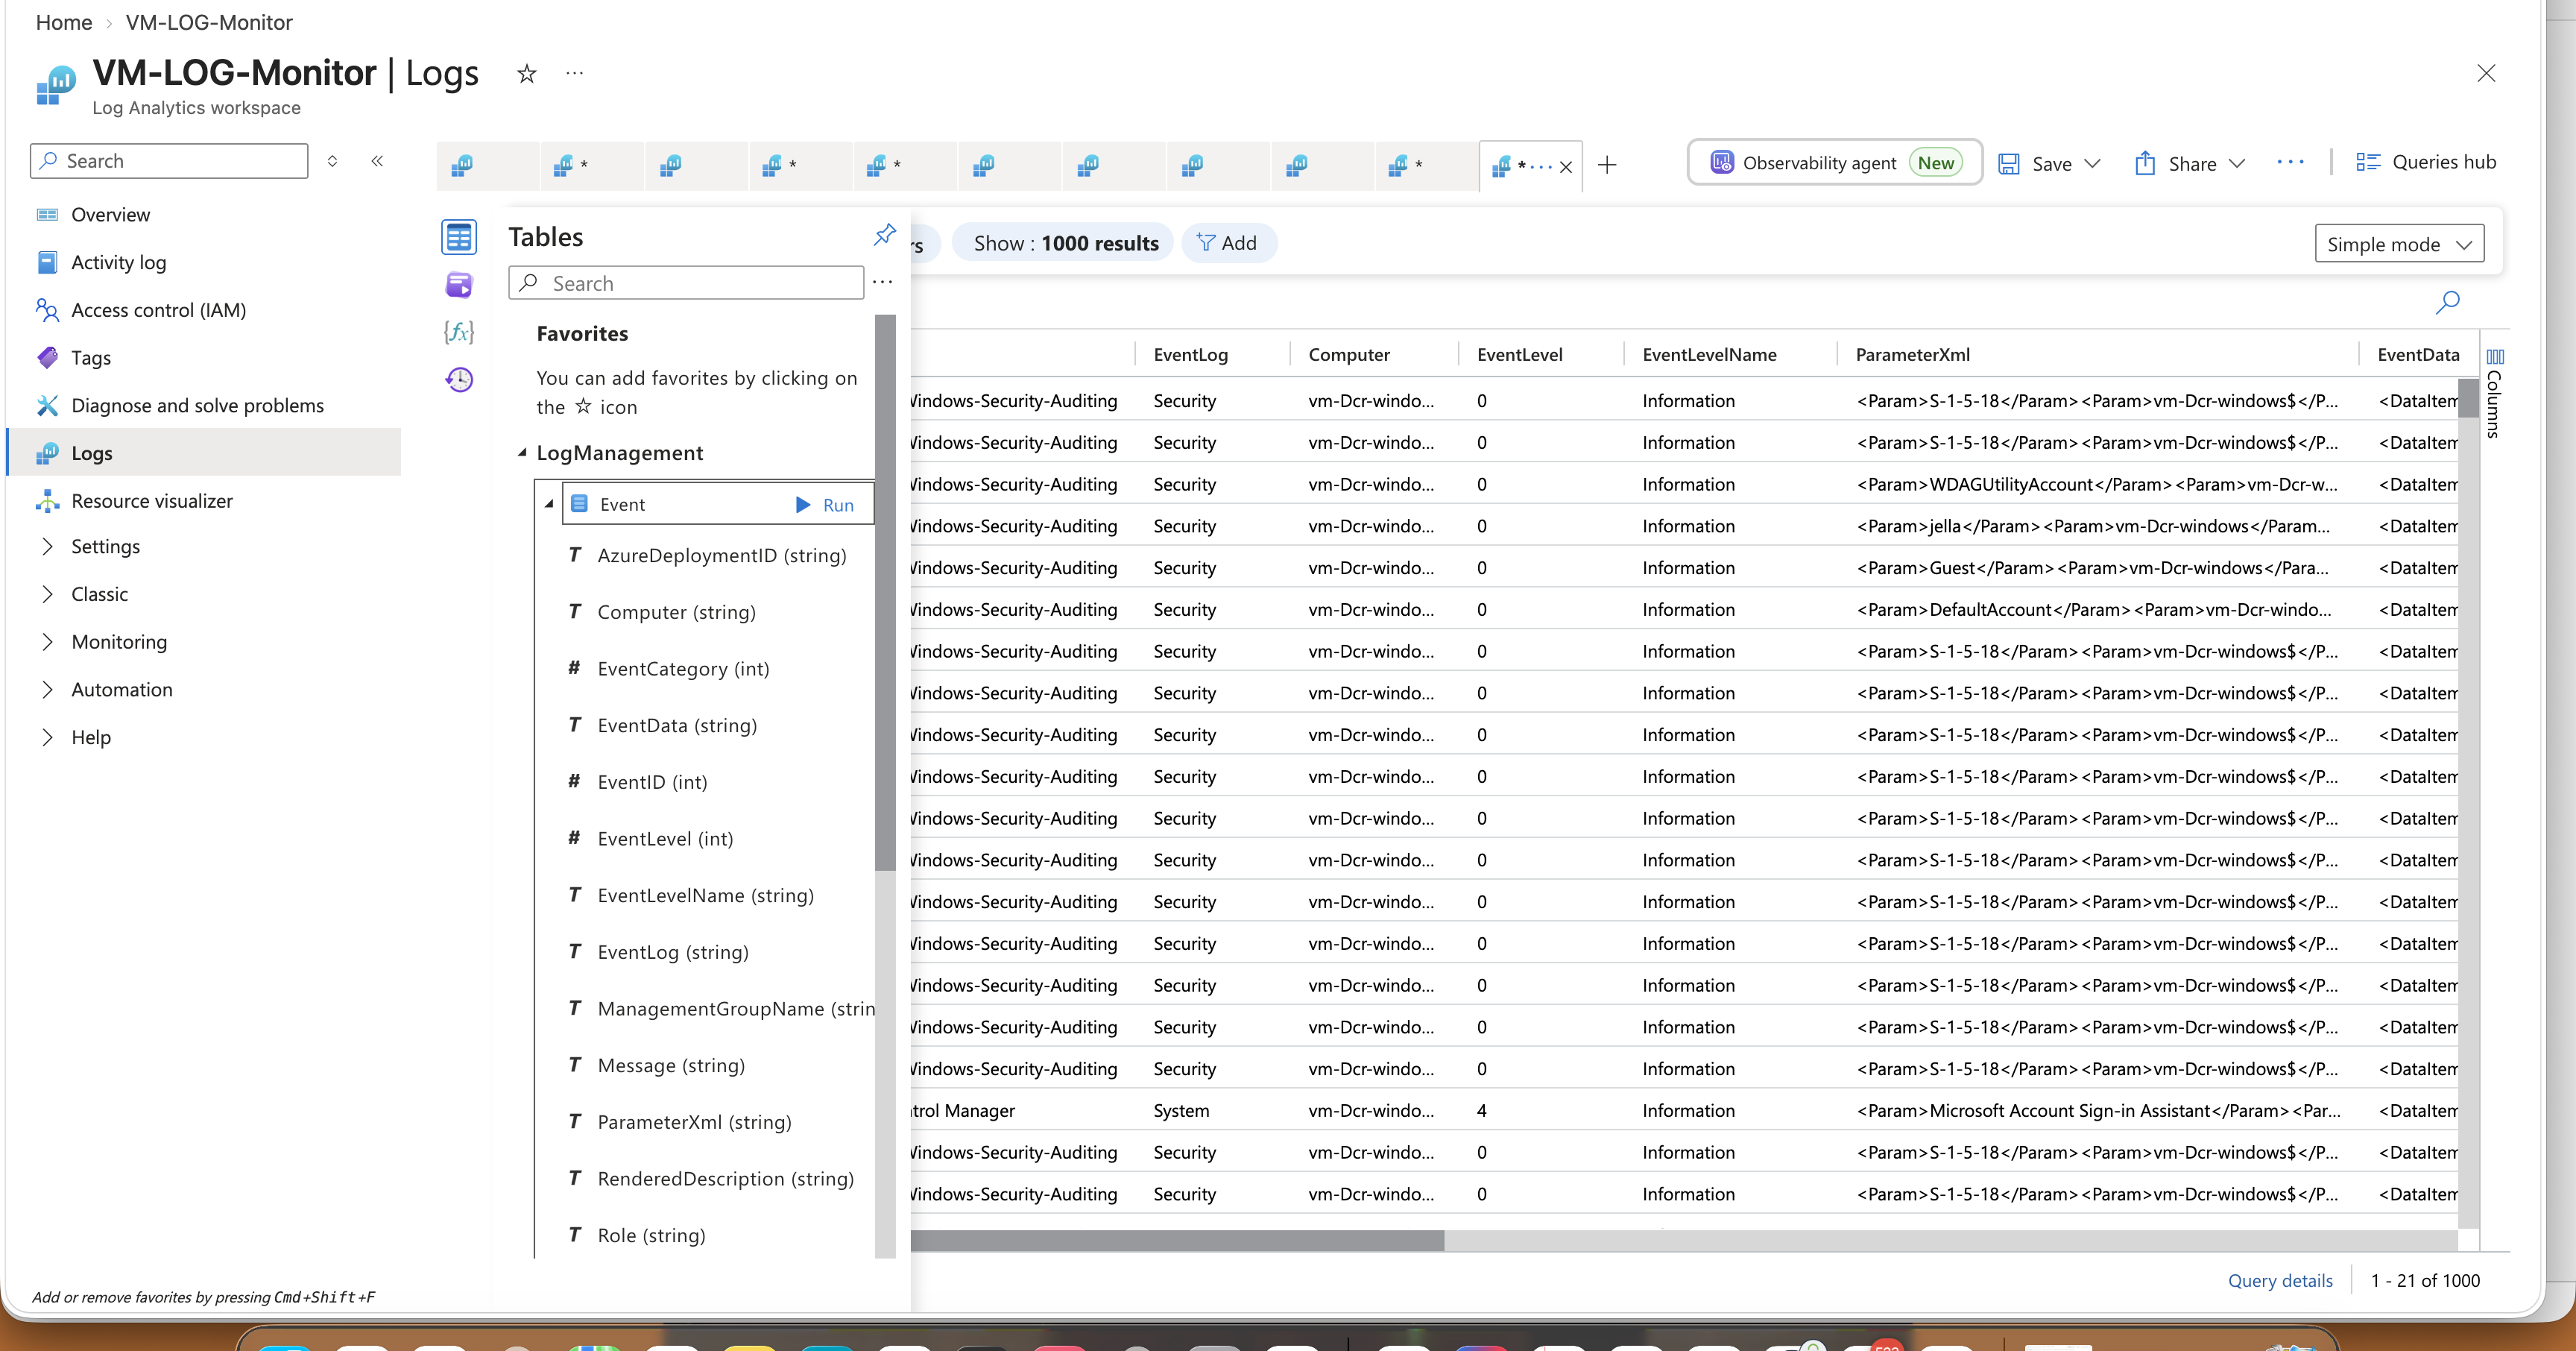
The collected events are stored in the Event table.
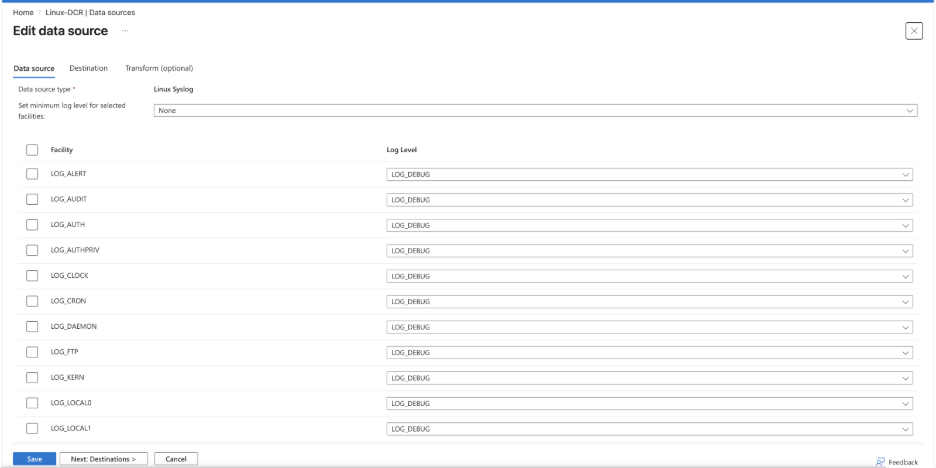
5.2 Linux Syslog
For Linux Syslog:
-
Select Linux Syslog as the data source type.
-
Select the required facilities.
-
Select the required minimum severity level.
-
Select the destination Log Analytics Workspace.
-
Save the data source configuration.
Example facilities:
• auth
• daemon
• kern
• local0 to local7
• syslog
• user
The collected events are stored in the Syslog table.
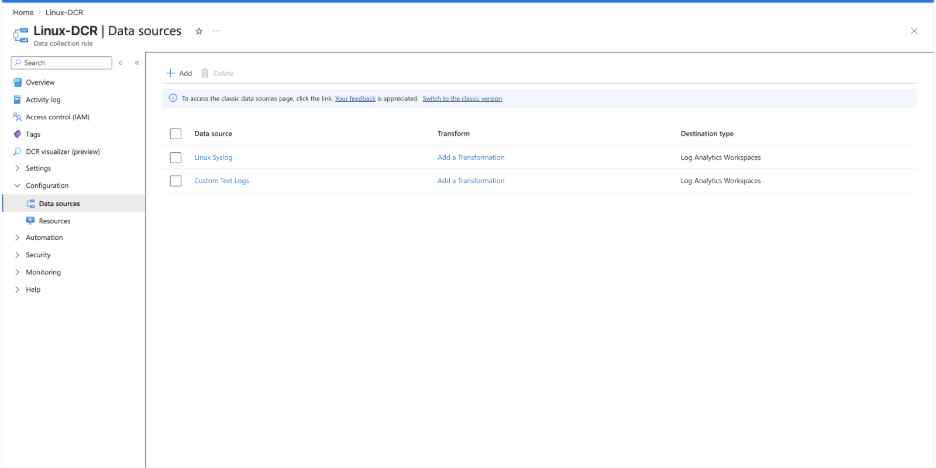
5.3 Custom Text Logs
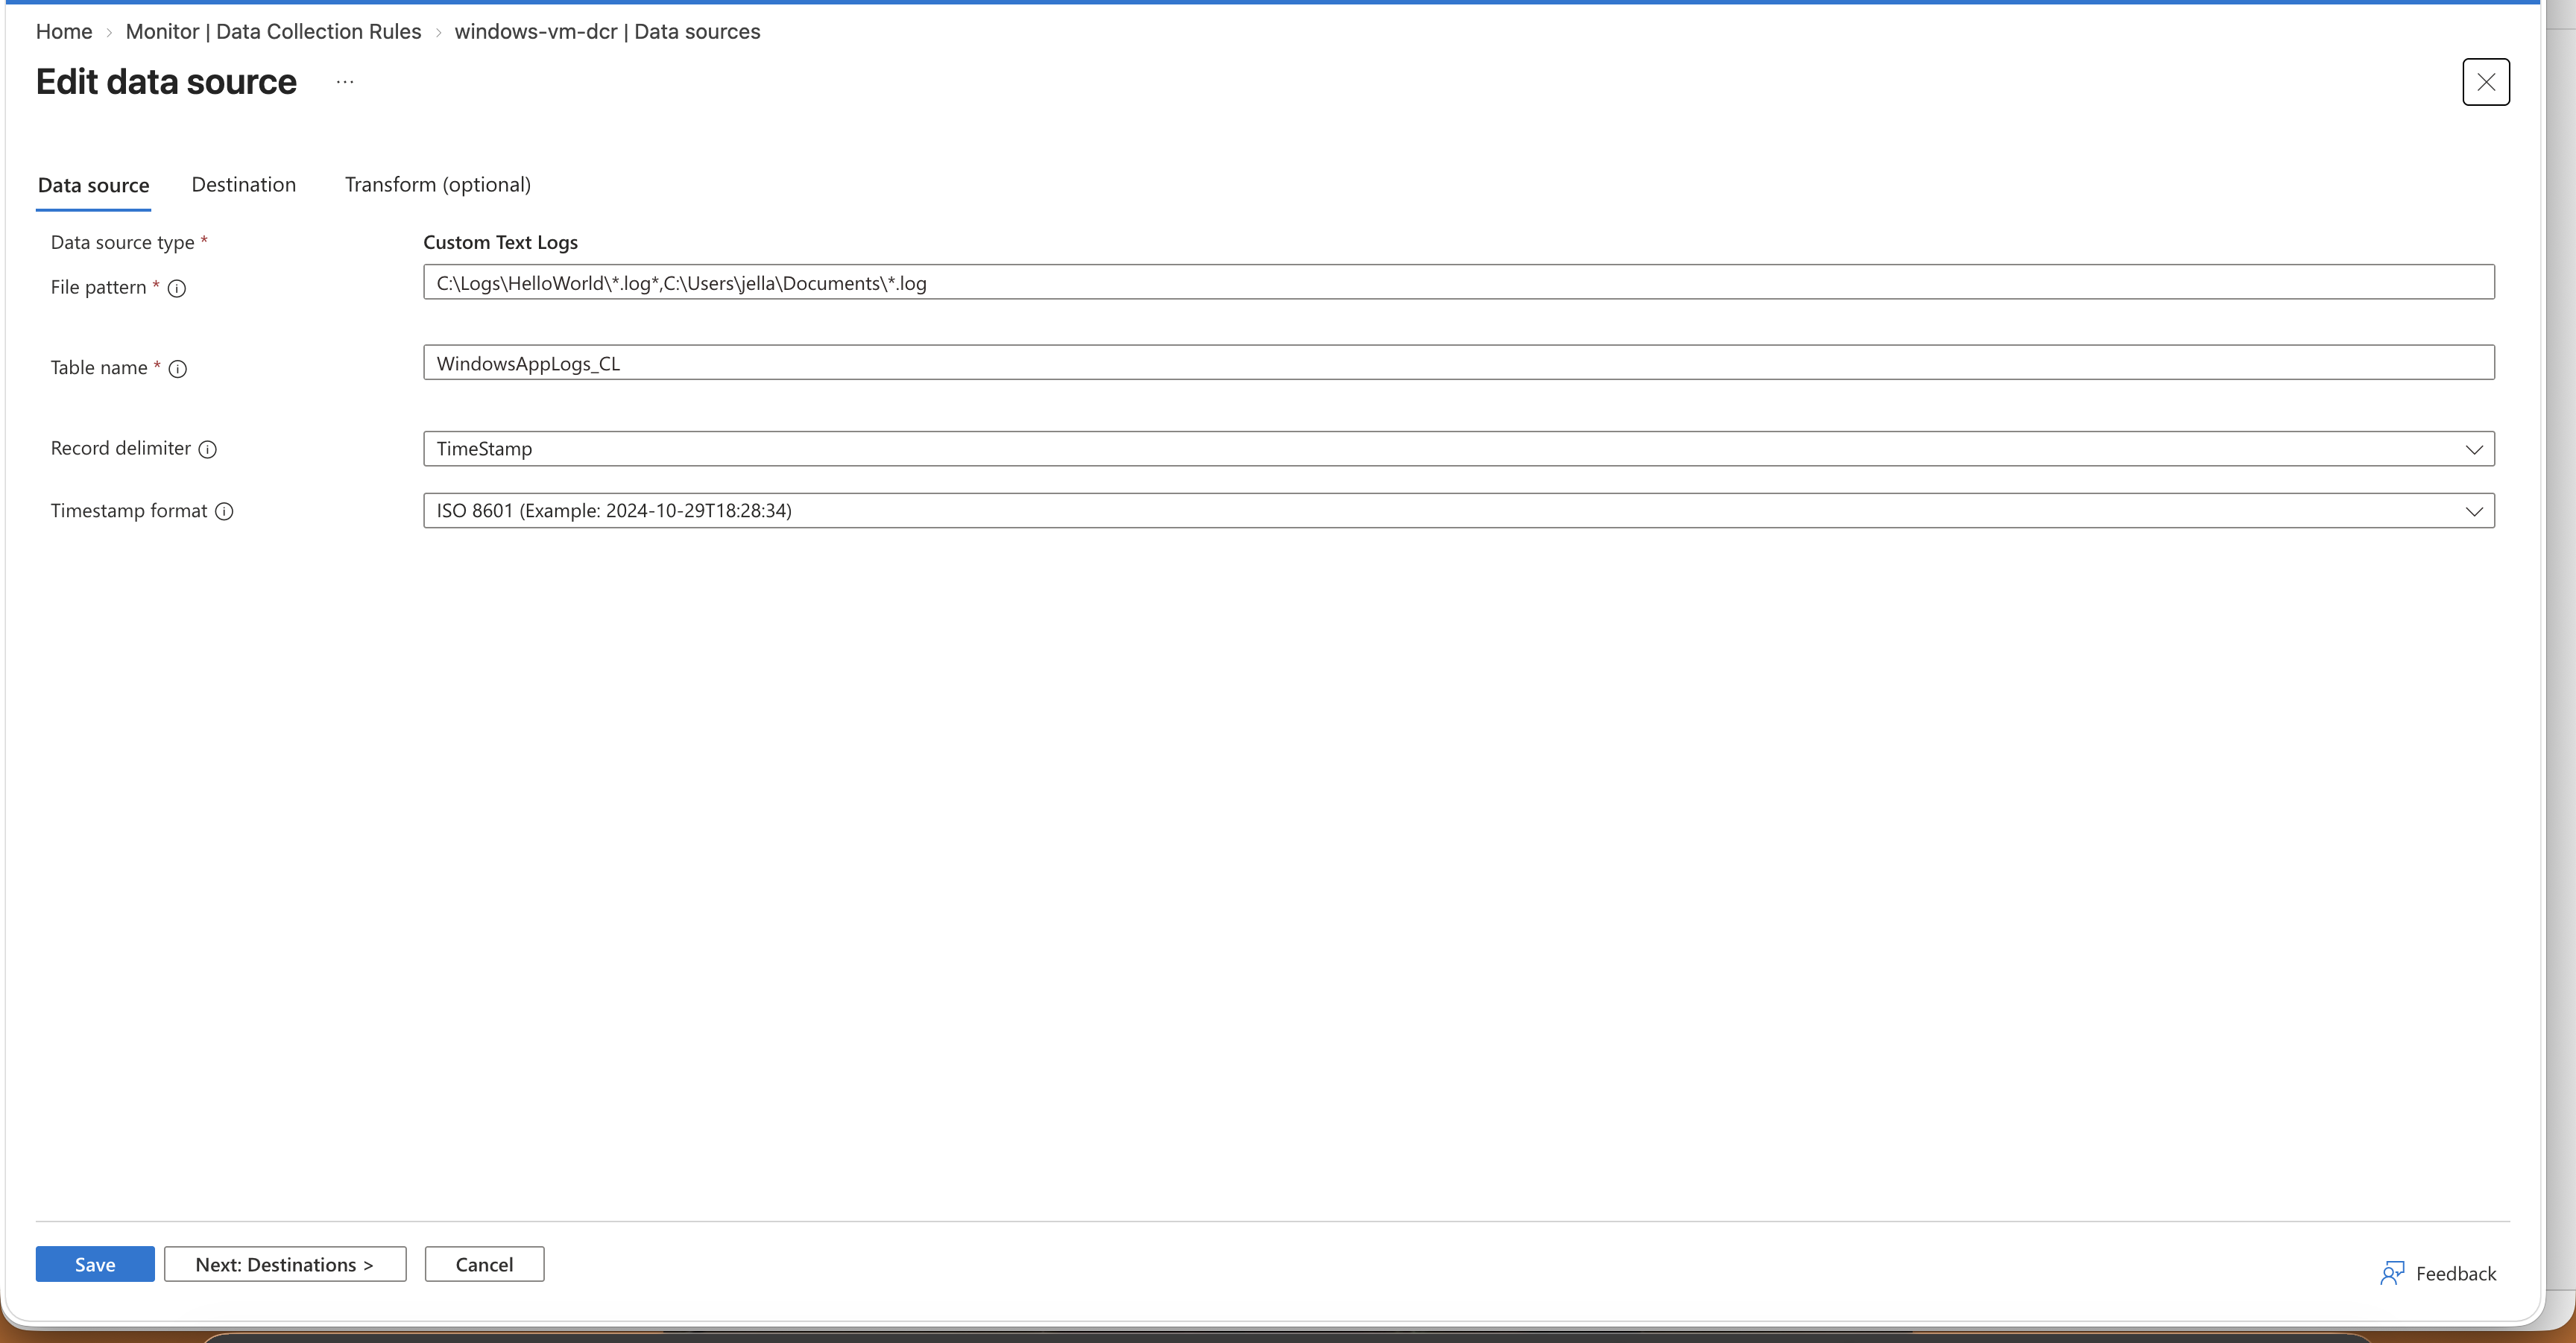
For Custom Text Logs:
-
Select Custom Text Logs as the data source type.
-
Enter the file path or file pattern.
Windows examples:
C:\Logs\Application.log
C:\Logs\Application*.log
C:\App01\AppLog.txt, C:\App02\AppLog.txt
Linux examples:
/var/log/myapp/application.log
/var/log/myapp/*.log
- Select the destination custom table.
Example:
ApplicationLogs_CL
-
Select TimeStamp as the record delimiter.
-
Select the timestamp format used by the application log.
-
Configure the transformation.
Use the following transformation when the source record can be stored without additional processing:
source
Linux Custom Text Log Example
Advantages
-
Native Azure collection method
-
Fewer components to deploy and maintain
-
Centralized DCR management
-
Built-in Windows Event Log and Linux Syslog support
-
Lower operational complexity
-
Direct integration with Log Analytics Workspace
Disadvantages
Issue Identified: Limited Timestamp Format Support in DCR
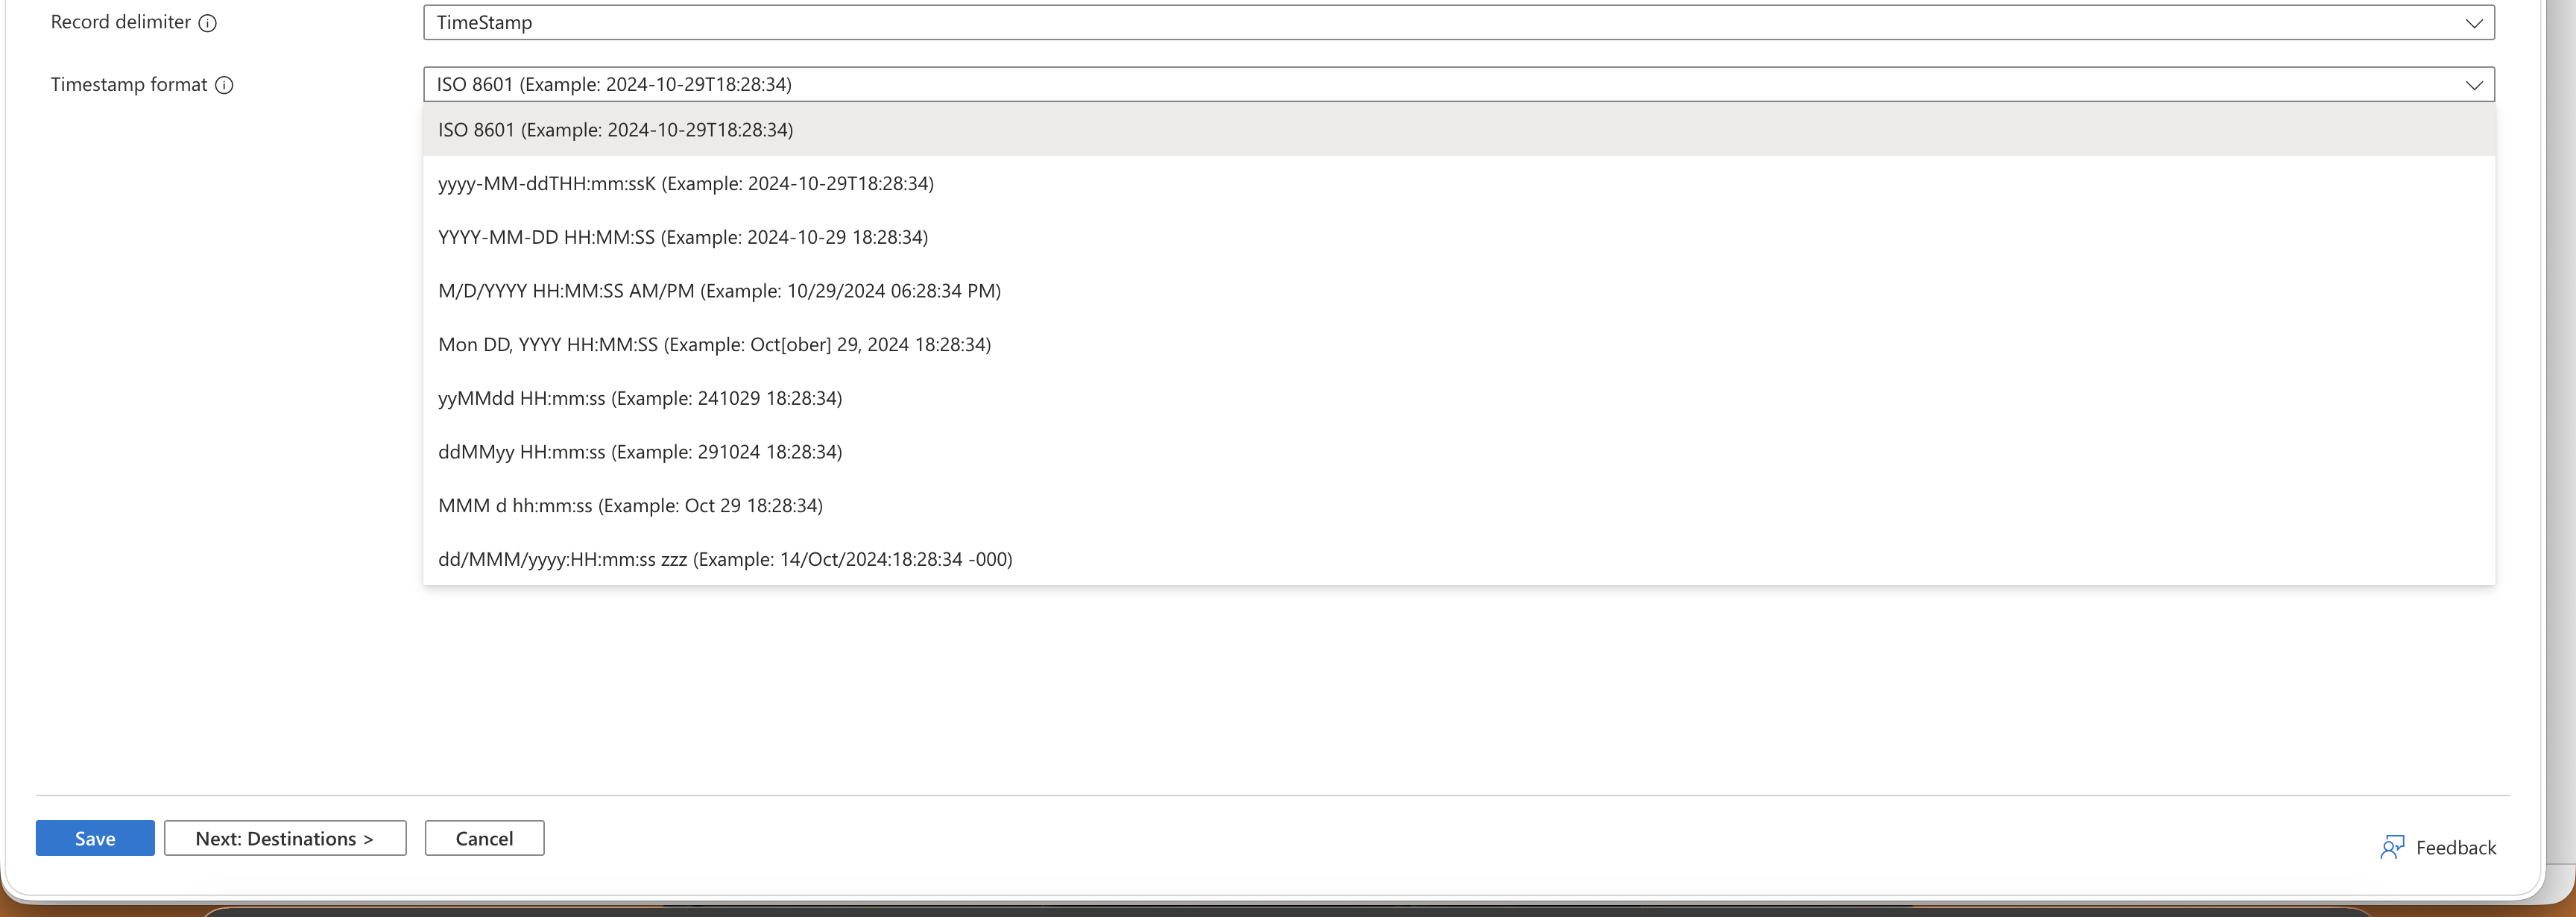
During the DCR Custom Text Logs analysis, we identified a limitation with timestamp/date format handling.
DCR allows us to select only from the supported timestamp formats available during configuration. It does not provide full flexibility to define every possible custom timestamp format used by different applications.
In real scenarios, different applications may write logs using different timestamp formats. If the application log timestamp format does not match the format configured in the DCR, DCR may not correctly identify the start of each log record.
Impact
-
DCR may fail to split multiline logs correctly.
-
Multiple log entries may be grouped into a single Log Analytics Workspace row.
-
A single DCR may not work properly for applications using different timestamp formats.
-
Each different timestamp format may require separate handling or separate configuration.
DCR works well when the log timestamp format matches the supported format selected in the DCR. However, when applications use unsupported or different timestamp formats, DCR cannot dynamically detect and parse those formats.
Conclusion
Based on this limitation, Microsoft recommended evaluating the Logs Ingestion API approach.
With Logs Ingestion API, logs can be processed before ingestion. This allows the VM-side collector or application logic to:
-
Handle different timestamp formats
-
Send structured records to Log Analytics Workspace through DCR
Approach 2: Fluent Bit and Logs Ingestion API
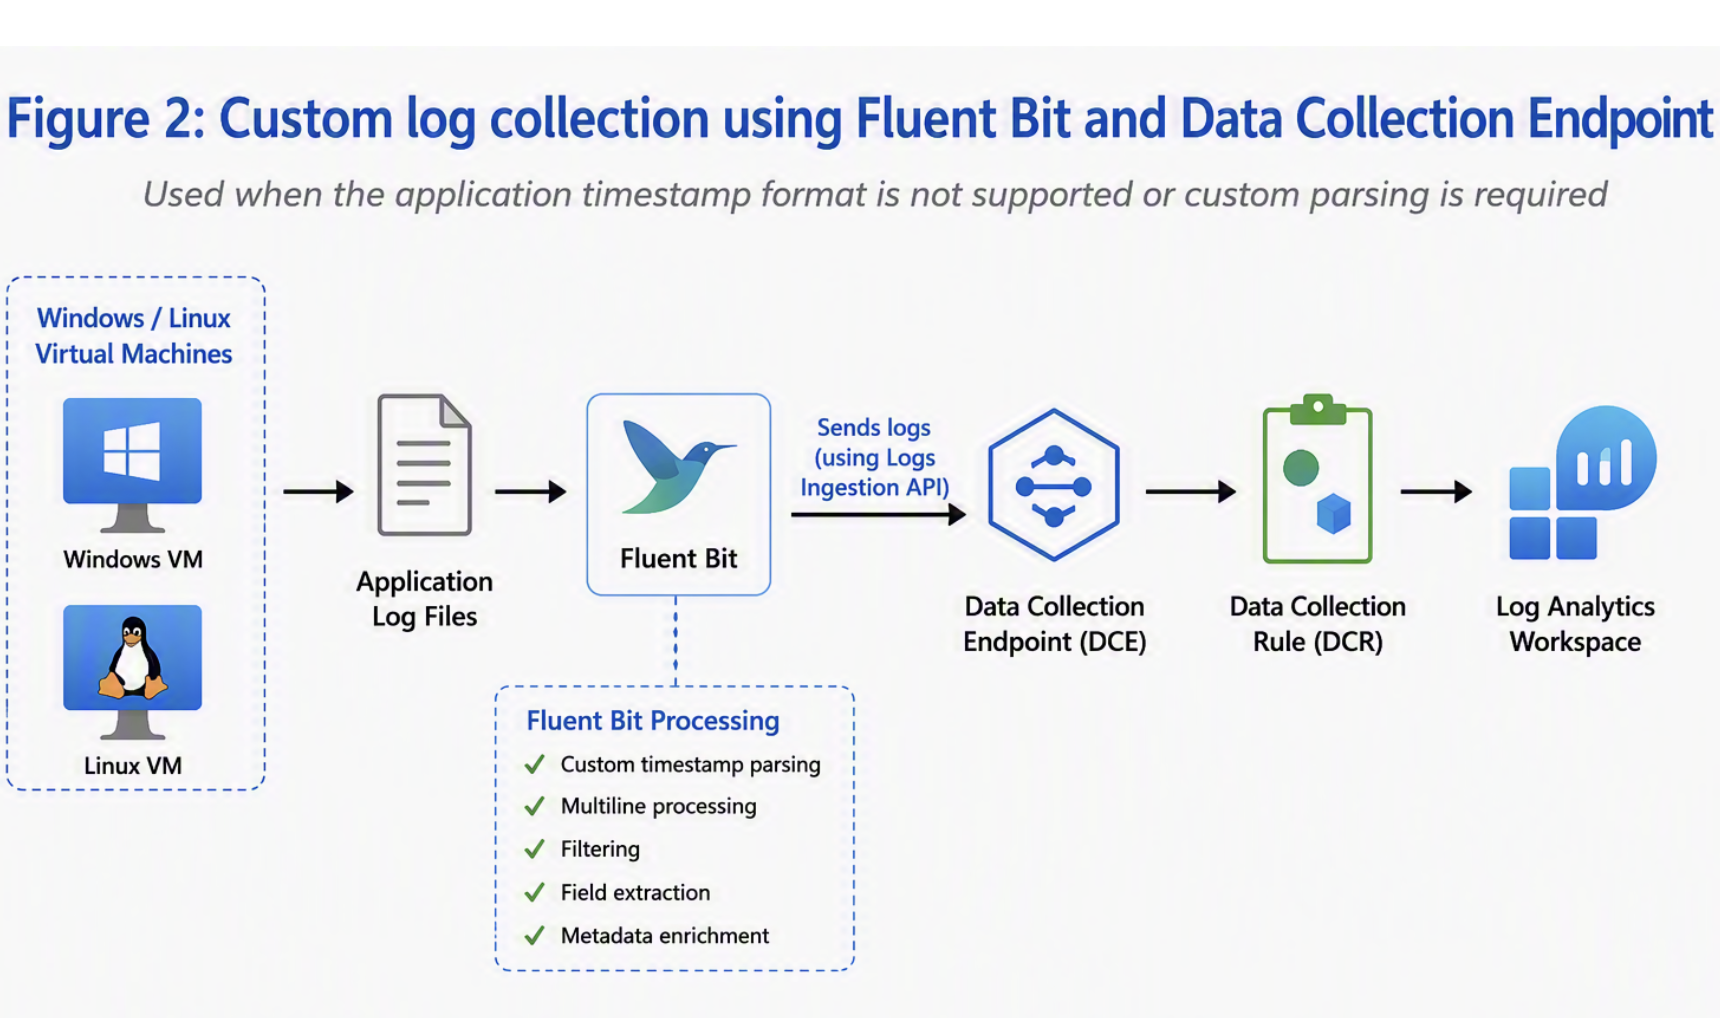
Fluent Bit Log Collection
Fluent Bit is used when application logs require processing that native DCR Custom Text Logs cannot provide.
-
Supports application timestamp formats not available in the Microsoft DCR configuration.
-
Identifies individual log-record boundaries.
-
Groups multiline logs and stack traces into a single event.
-
Filters unwanted records and extracts required fields.
-
Adds source metadata such as VM name, application name, and log-file path.
-
Sends structured records to Azure Monitor through the Logs Ingestion API.
-
Buffers and retries logs during temporary delivery failures.
Fluent Bit Architecture
Application log file ↓ Fluent Bit ↓ Custom parsing and processing ↓ Structured log record ↓ Data Collection Endpoint ↓ Data Collection Rule ↓ Log Analytics Workspace
Fluent Bit Configuration Steps
- Create Data Collection Rule (DCR)
A Data Collection Rule was created to handle incoming log data through the Logs Ingestion API.
DCR Name:
dcr-logs-ingestion-api
The DCR is responsible for defining:
-
Incoming stream schema
-
Transformation logic
-
Destination mapping
-
Output table mapping
-
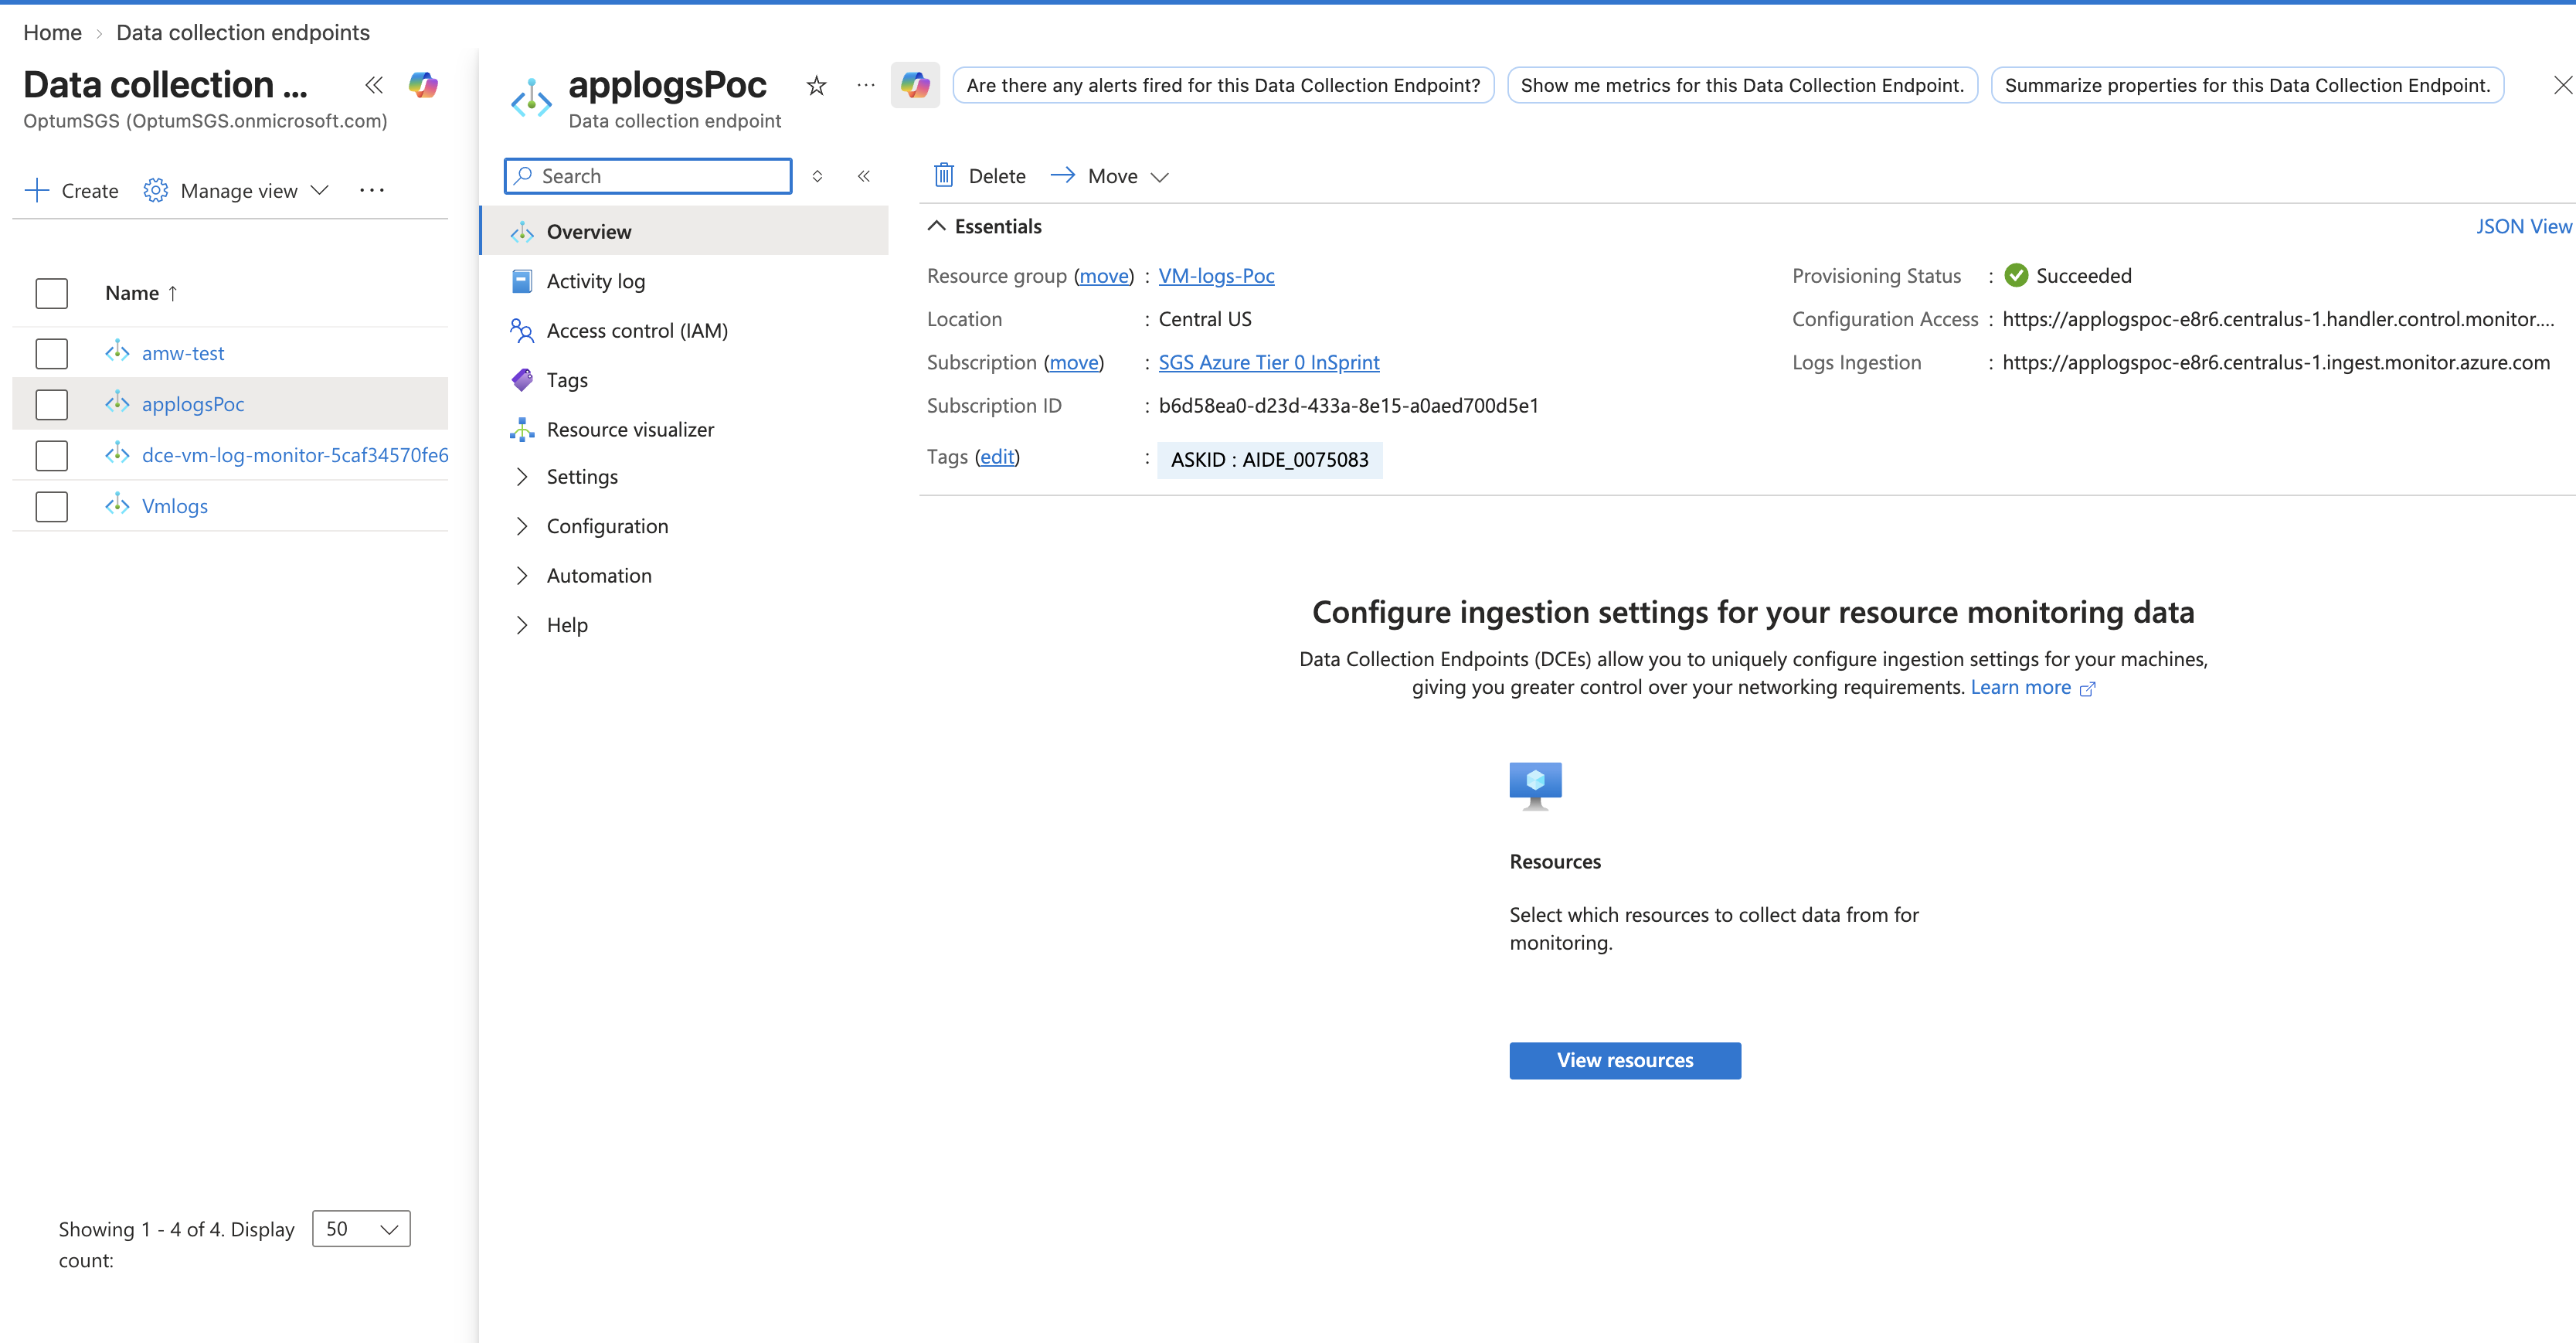
Create Data Collection Endpoint (DCE)
A Data Collection Endpoint was created to receive log data from the API call.
DCE Name:
applogsPoc
The DCE provides the Logs Ingestion API endpoint URL used by the VM-side script or application.
- Create Custom Table in Log Analytics Workspace
Custom tables were created in the Log Analytics Workspace to store the ingested log records.
Custom Tables:
LogsIngestionApi_CL
LogIngestionPoc2_CL
The incoming JSON payload must match the schema of the target custom table.
- Assign Role to App Registration
An App Registration was used for authentication.
The following role was assigned to the App Registration at the DCR scope:
Role:
Monitoring Metrics Publisher
Scope:
dcr-logs-ingestion-api
This permission allows the application or VM-side script to send logs to the DCR using the Logs Ingestion API.
- DCR JSON View Components
After creating the DCR, the JSON view was reviewed to validate the required configuration components.
The main DCR JSON components are:
5.a. Immutable ID
The immutable ID is required in the Logs Ingestion API URL.
Example:
"immutableId": "dcr-6caea691982c420098f702461f1ca9e5"
5.b. Data Collection Endpoint ID
This shows the DCE linked to the DCR.
Example:
"dataCollectionEndpointId": "/subscriptions/.../dataCollectionEndpoints/applogsPoc"
5.c. Stream Declarations
Stream declarations define the expected incoming JSON schema.
Example stream:
Custom-LogsIngestionApi_CL
Example columns:
TimeGenerated datetime
Computer string
ApplicationName string
LogFilePath string
Level string
RawLog string
5.d. Destinations
The destination points to the target Log Analytics Workspace.
Example:
Destination Log Analytics Workspace:
vm-log-monitor
5.e. Data Flows
Data flows define how each stream is routed to the target custom table.
Example:
Stream:
Custom-LogsIngestionApi_CL
Output Table:
LogsIngestionApi_CL
Transformation:
source
Second stream:
Stream:
Custom-LogIngestionPoc2_CL
Output Table:
LogIngestionPoc2_CL
Transformation:
source
Note:
- Multiple Tables Using One DCR
During the POC, we confirmed that one DCR can support multiple custom tables.
The same DCE, DCR, and App Registration can be reused.
Only the stream name changes in the API URL.
Example mapping:
Custom-LogsIngestionApi_CL
-> LogsIngestionApi_CL
Custom-LogIngestionPoc2_CL
-> LogIngestionPoc2_CL
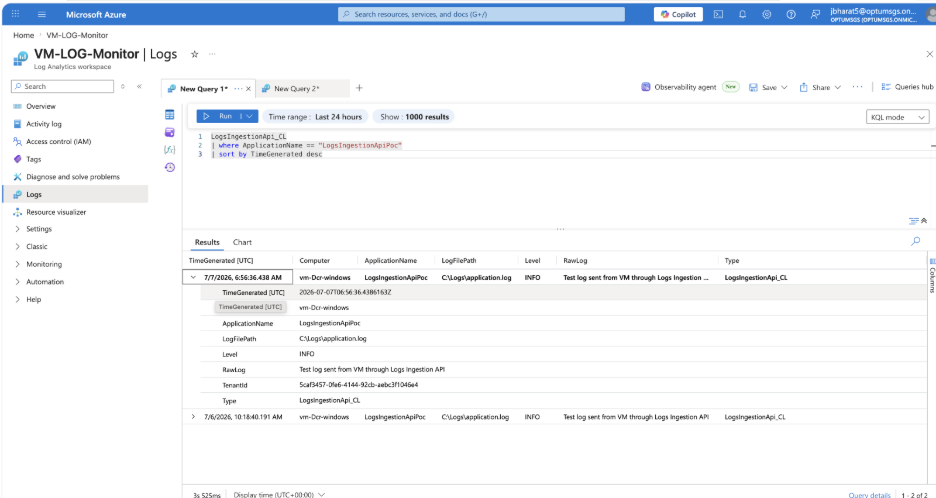
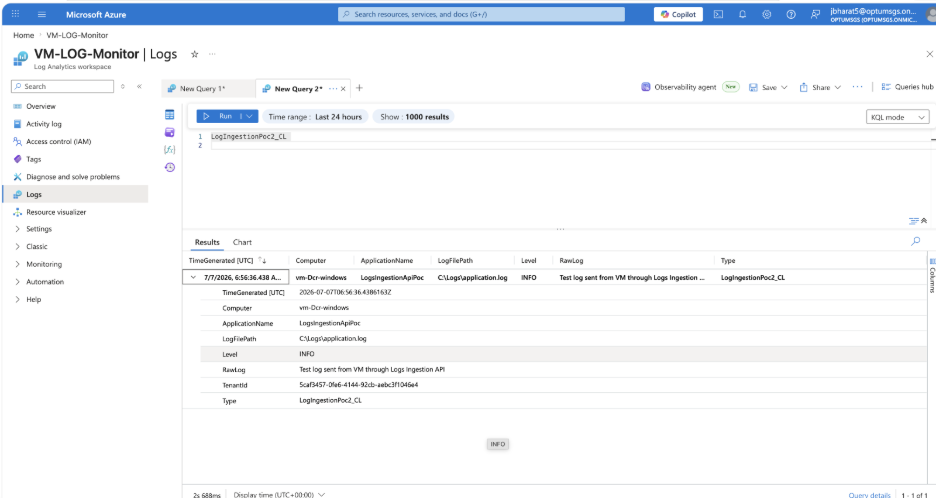
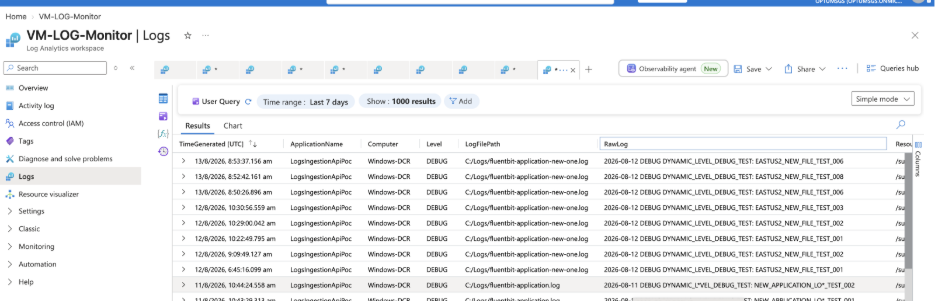
The above Pictures shows The Logs in Law generated through the DCR
Disaster Recovery.
Replication in the Log analytics Workspace
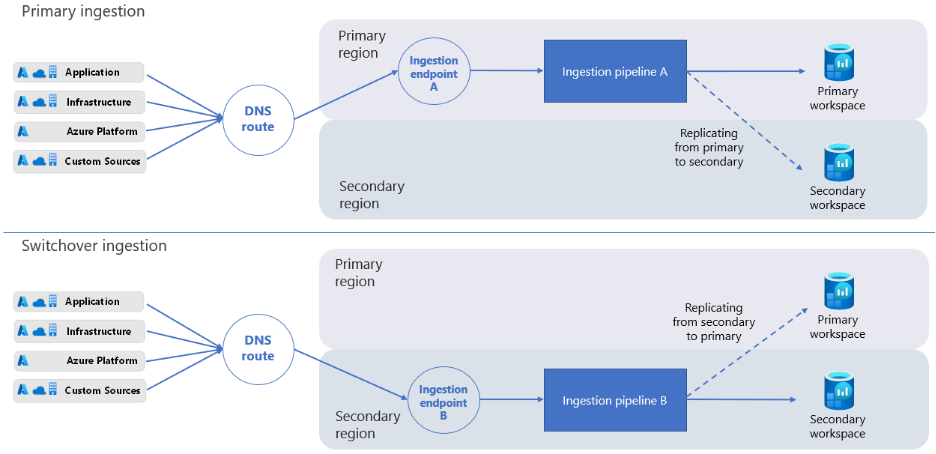
Your original workspace and region are referred to as the primary. The replicated workspace and alternate region are referred to as the secondary.
The workspace replication process creates an instance of your workspace in the secondary region. The process creates the secondary workspace with the same configuration as your primary workspace, and Azure Monitor automatically updates the secondary workspace with any future changes you make to your primary workspace configuration.
The secondary workspace is a "shadow" workspace for resilience purposes only. You cannot see the secondary workspace in the Azure portal, and you cannot manage or access it directly.
When you enable workspace replication, Azure Monitor sends new logs ingested to your primary workspace to your secondary region also. Logs you ingest to the workspace before you enable workspace replication are not copied over.
If an outage affects your primary region, you can switch over and reroute all ingestion and query requests to your secondary region. After Azure mitigates the outage and your primary workspace is healthy again, you can switch back over to your primary region.
When you switch over, the secondary workspace becomes active and your primary becomes inactive. Azure Monitor then ingests new data through the ingestion pipeline in your secondary region, rather than the primary region. When you switch over to your secondary region, Azure Monitor replicates all data you ingest from the secondary region to the primary region. The process is asynchronous and does not affect your ingestion latency.
Note:
After you switch over to the secondary region, if the primary region cannot process incoming log data, Azure Monitor buffers the data in the secondary region for up to 11 days. During the first four days, Azure Monitor automatically reattempts to replicate the data periodically.
Data Protection
Azure Monitor has several mechanisms to ensure that data in transit is not lost when there is a failure in the primary region.
Azure Monitor protects data that reaches the primary region's ingestion endpoint when the primary region's pipeline is unavailable to process the data. When the pipeline becomes available, it continues to process data in transit, and Azure Monitor ingests and replicates the data to the secondary region.
If the primary region's ingestion endpoint is not available, Azure Monitor Agent regularly retries sending log data to the endpoint. The data ingestion endpoint in the secondary region starts to receive data from agents a few minutes after you trigger switchover.
Implementation
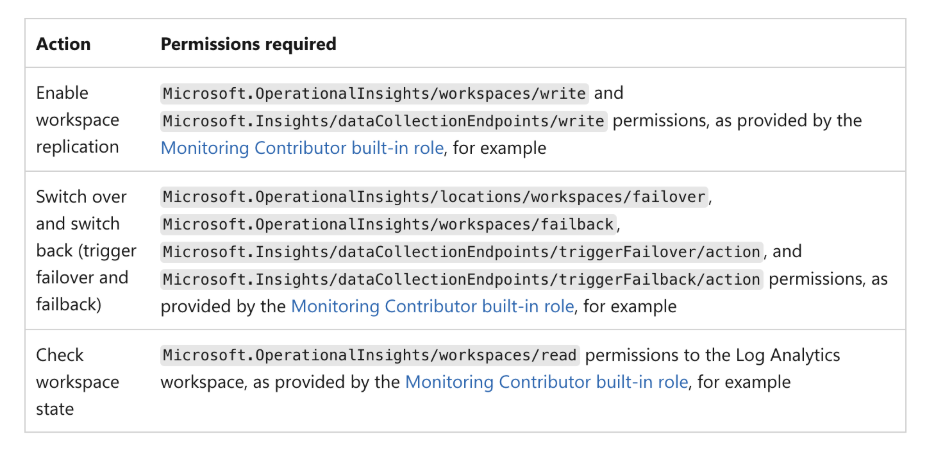
Permissions Required:
Steps for implementation:
Step1: Enabling the Replication. It can be done using Rest api and the Az cli
az rest --method put --uri "/subscriptions/
"properties": {
"replication": {
"enabled": true,
"location": "
}
},
"location": "
} example: az rest --method put \
--uri "/subscriptions/b6d58ea0-d23d-433a-8e15-a0aed700d5e1/resourceGroups/vm-logs-
poc/providers/Microsoft.OperationalInsights/workspaces/VM-LOG-Monitor?api-version=2025-02-01" \
--body '{
"properties": {
"replication": {
"enabled": true,
"location": "eastus2"
}
},
"location": "centralus"
}'
Once replication is done You can check with the following command
az rest --method get \
--uri "/subscriptions/b6d58ea0-d23d-433a-8e15-a0aed700d5e1/resourceGroups/vm-logs-
poc/providers/Microsoft.OperationalInsights/workspaces/VM-LOG-Monitor?api-version=2025-02-01" \
--query properties.replication
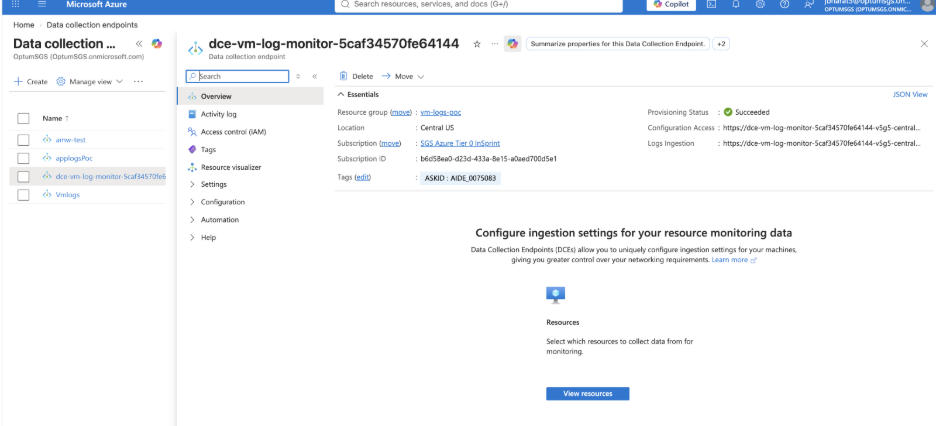
After the Replication is done the system generated DCE will be created.
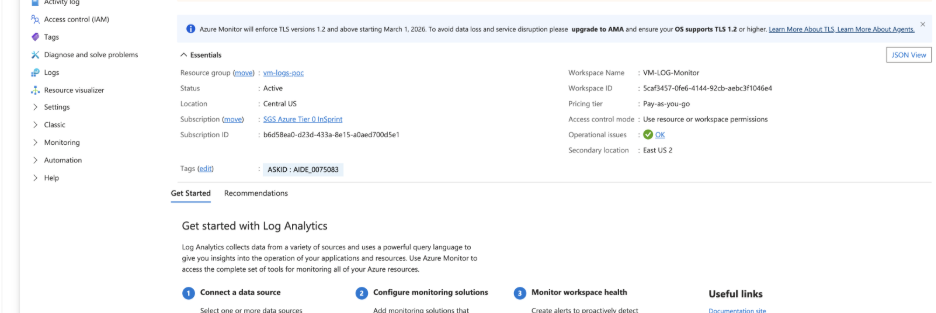
When you check the LAW, you can see the Secondary location.
Step2: Configuring DCR with the Newly created DCE.
-
In the Azure portal, select Data collection rules.
-
From the Data collection rules screen, select a data collection rule that sends data to your primary Log Analytics workspace.
-
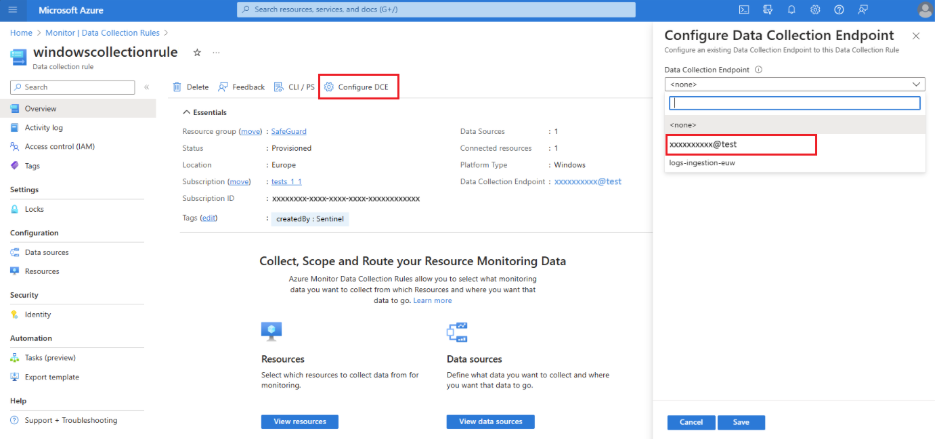
On the data collection rule Overview page, select Configure DCE and select the workspace data collection endpoint from the available list:
Now we have to configure our DCR with the Newly System Created DCE endpoint after the replication is enabled.
Step3: Switch Over to the Secondary Workspace
You decide when to switch over to your secondary workspace and switch back to your primary workspace based on ongoing performance and health monitoring and your system standards and requirements.
Logs ingested to your primary workspace before you enable replication are not copied to the secondary workspace. If you enabled workspace replication three hours ago and you now switch over to your secondary workspace, your queries can only return data from the last three hours.
using the following command we have to do switch Over:
az monitor log-analytics workspace failover --resource-group
Example:
az monitor log-analytics workspace failover \
--resource-group vm-logs-poc \
--workspace-name VM-LOG-Monitor \
--location eastus2
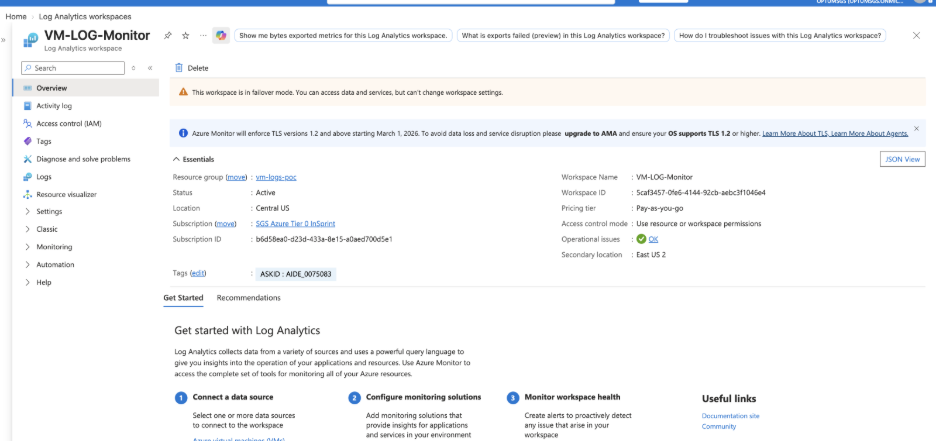
You will see the LAW status as Below after the Switch over.
step4: Fluent Bit setup:
Now we need to use the System created DCE in the Fluent bit set up
Name azure_logs_ingestion
Match azure.application.logs
dce_url https://dce-vm-log-monitor-5caf34570fe64144-v5g5-centralus.logs.z1.ingest.monitor.azure.com
dcr_id dcr-6caea691982c420098f702461f1ca9e5
table_name LogIngestionPoc2_CL
tenant_id fbe00597-xxxxxxxxxxxx
client_id 2xxxxxxxxxxxxx
client_secret H~o8xxxxxxxxxxxxxx
compress true
time_generated true
time_key TimeGenerated
Retry_Limit no_limits
Workers 1
RPO and RTO
RTO: Microsoft does not publish a fixed RTO for Log Analytics Workspace Replication. Because switchover is manually initiated, the overall recovery time depends on how quickly the customer detects the issue, approves and triggers the switchover, plus the time Azure requires to activate routing to the secondary region and validate service recovery.
RPO: Microsoft does not publish a fixed or contractual RPO for Log Analytics Workspace Replication. Near-zero data-loss exposure is expected for logs successfully ingested and replicated by Azure Monitor after workspace replication was enabled. After switchover, if the primary region cannot process replication traffic from the active secondary region, Azure Monitor buffers the data in the secondary region for up to 11 days and periodically retries replication during the first four days. This protection applies only to data that has successfully reached Azure Monitor in the active secondary region.
PRICING
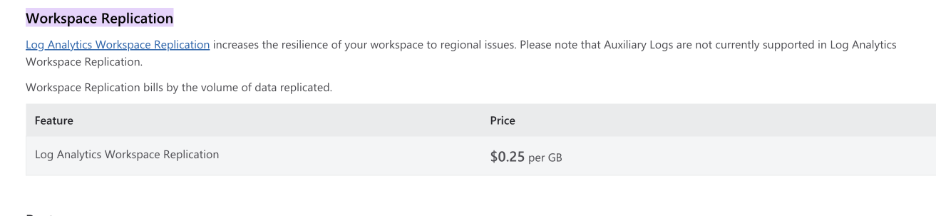
It is Charged on the Volume of the Data Replicated. it is 0.25$ per GB
Related Documents
Table 11: Related Documents
| Document Name | Document Location |
|---|---|
| Disaster Recovery Of the LAW | https://learn.microsoft.com/en-us/azure/azure-monitor/logs/workspace-replication?tabs=azure-cli |
| Pricing for LAW | https://azure.microsoft.com/en-us/pricing/details/monitor/#:~:text=10%5E9%20bytes.-,Workspace%20Replication,-Log%20Analytics%20Workspace |
| Log Ingestion API | https://learn.microsoft.com/en-us/azure/azure-monitor/logs/logs-ingestion-api-overview |
| Creation Of DCR | https://docs.azure.cn/en-us/azure-monitor/data-collection/data-collection-rule-create-portal |
| Microsoft Ticket | FW_ In The DCR I want use the Custom Date Format - TrackingID#2606290030005685.eml |
LAW-DR microsoft tikeclet.pdf | | DCR and windows and Linux Logs, Custom logs text logs and Json Logs | Collect text file from virtual machine with Azure Monitor: https://learn.microsoft.com/en-us/azure/azure-monitor/vm/data-collection-log-text
Collect JSON file from virtual machine with Azure Monitor: https://learn.microsoft.com/en-us/azure/azure-monitor/vm/data-collection-log-json
Collect Syslog events with Azure Monitor Agent: https://learn.microsoft.com/en-us/azure/azure-monitor/vm/data-collection-syslog
https://learn.microsoft.com/en-us/azure/azure-monitor/vm/data-collection-windows-events |